CHR MARKET UPDATE
Findings Through Week 31, 2020
The average weekly sales price has skyrocketed, properties are going under contract in record numbers and inventory is staying low.
Week 31 began on July 22nd and ended on July 28th.
New Listings
New listings reflect seller attitudes on whether this is a good time to be selling. The number of new listings hitting the market in Week 31 was up 4% to 11% levels seen in the three prior years.
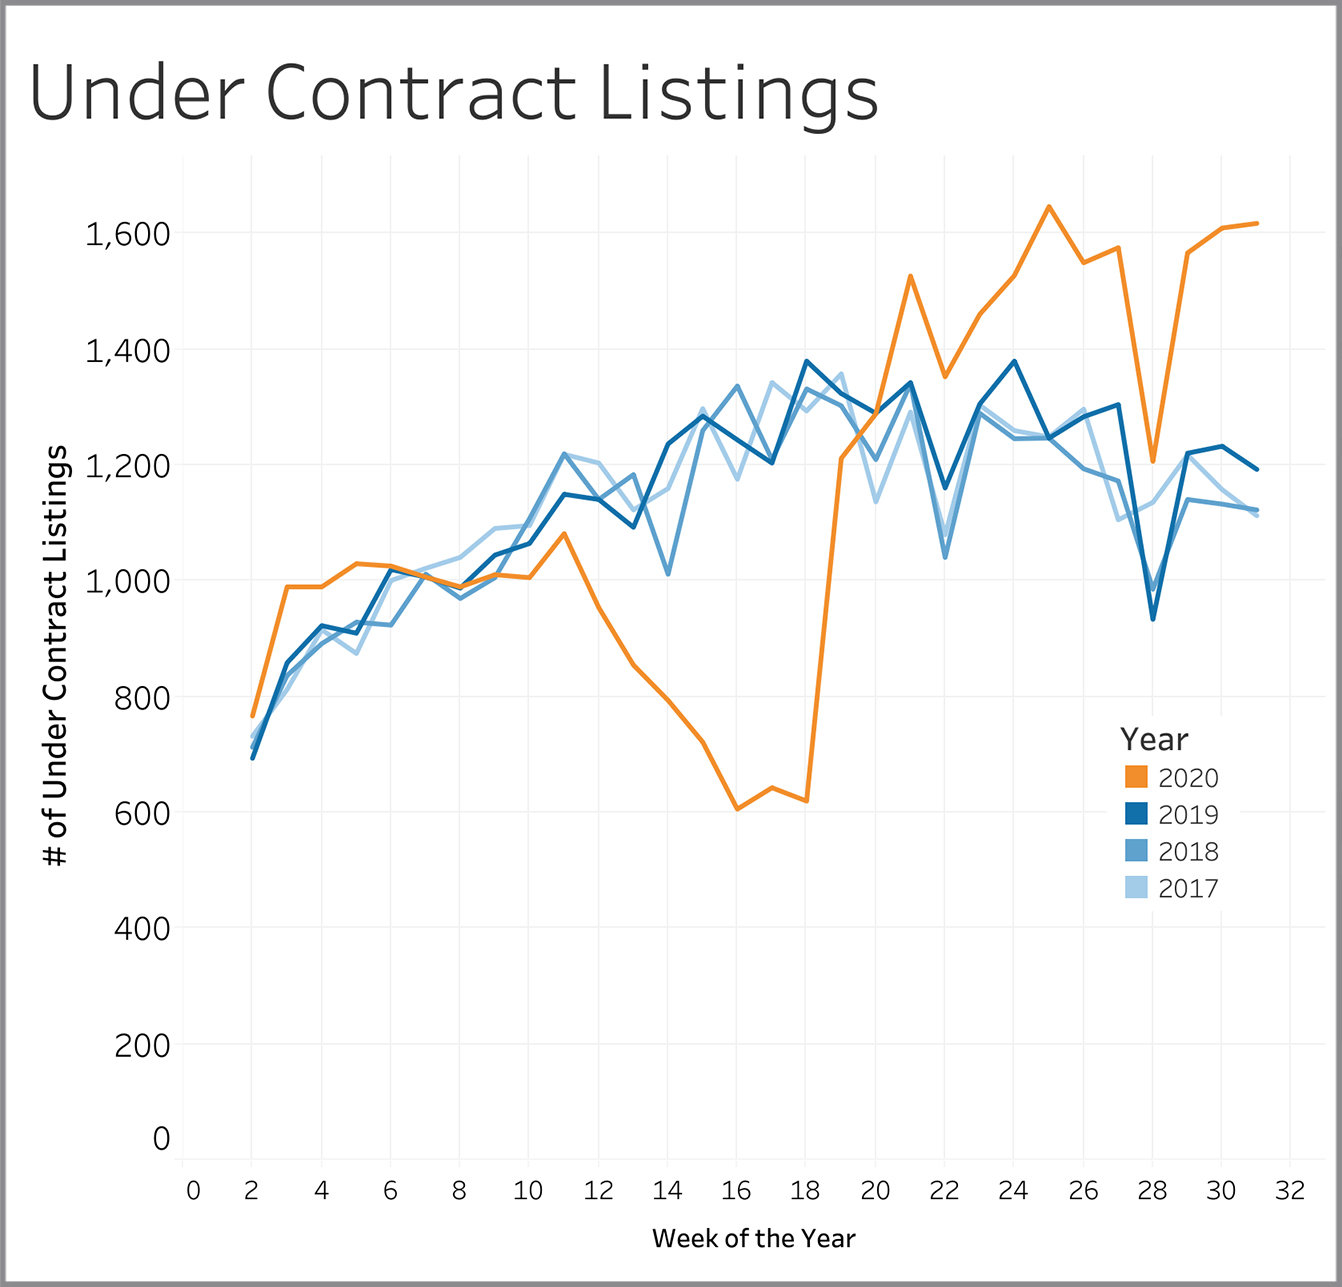
Under Contract Listings
Properties going under contract show us whether buyers are confident to do business in the current market environment. The number continues to soar compared to was seen in prior years. For the several weeks, the number has closely matched the number of new homes coming on the market.
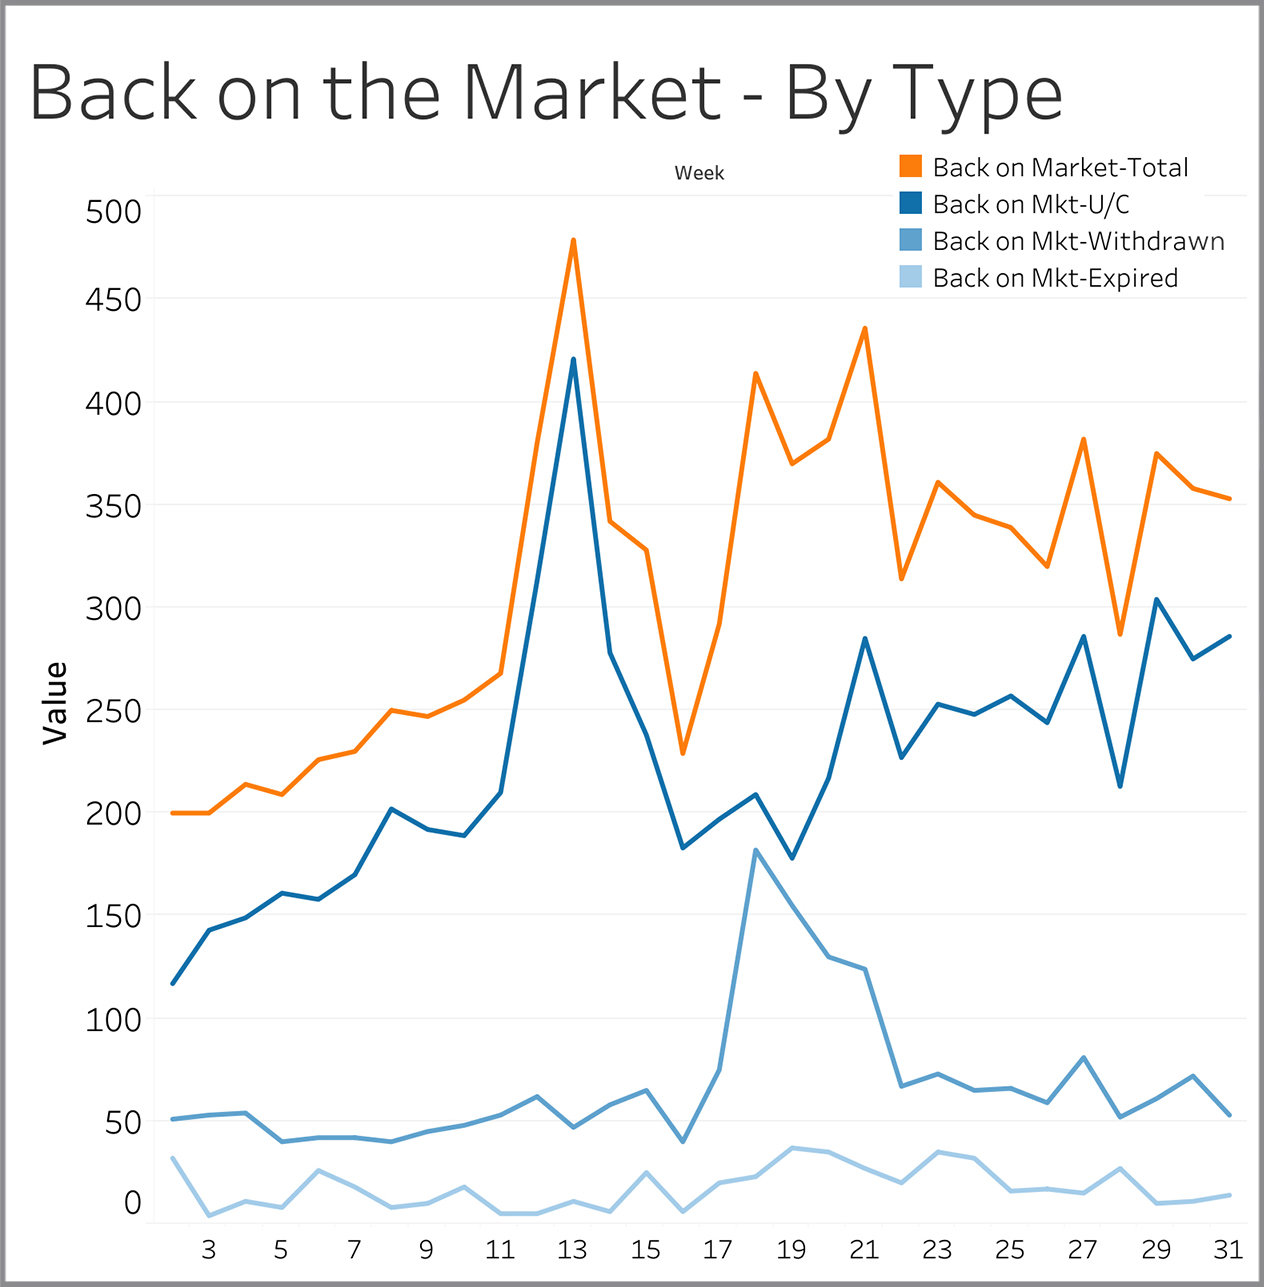
Back on Market – By Type
Listings come back on the market for three reasons: (1) Seller lost a deal with one buyer and is now looking for another one; (2) Seller took a break from showing the property and is now allowing showings again; (3) Seller let his/her listing expire and then came back to the market within 30 days with either the same agent or a different agent. Losing a buyer accounted for over 80% of the properties coming back to the market in Week 31. The overall number of homes coming back on the market was 353 in Week 31, essentially identical to the 351 we saw in the same week in 2019 (data not shown on this chart).
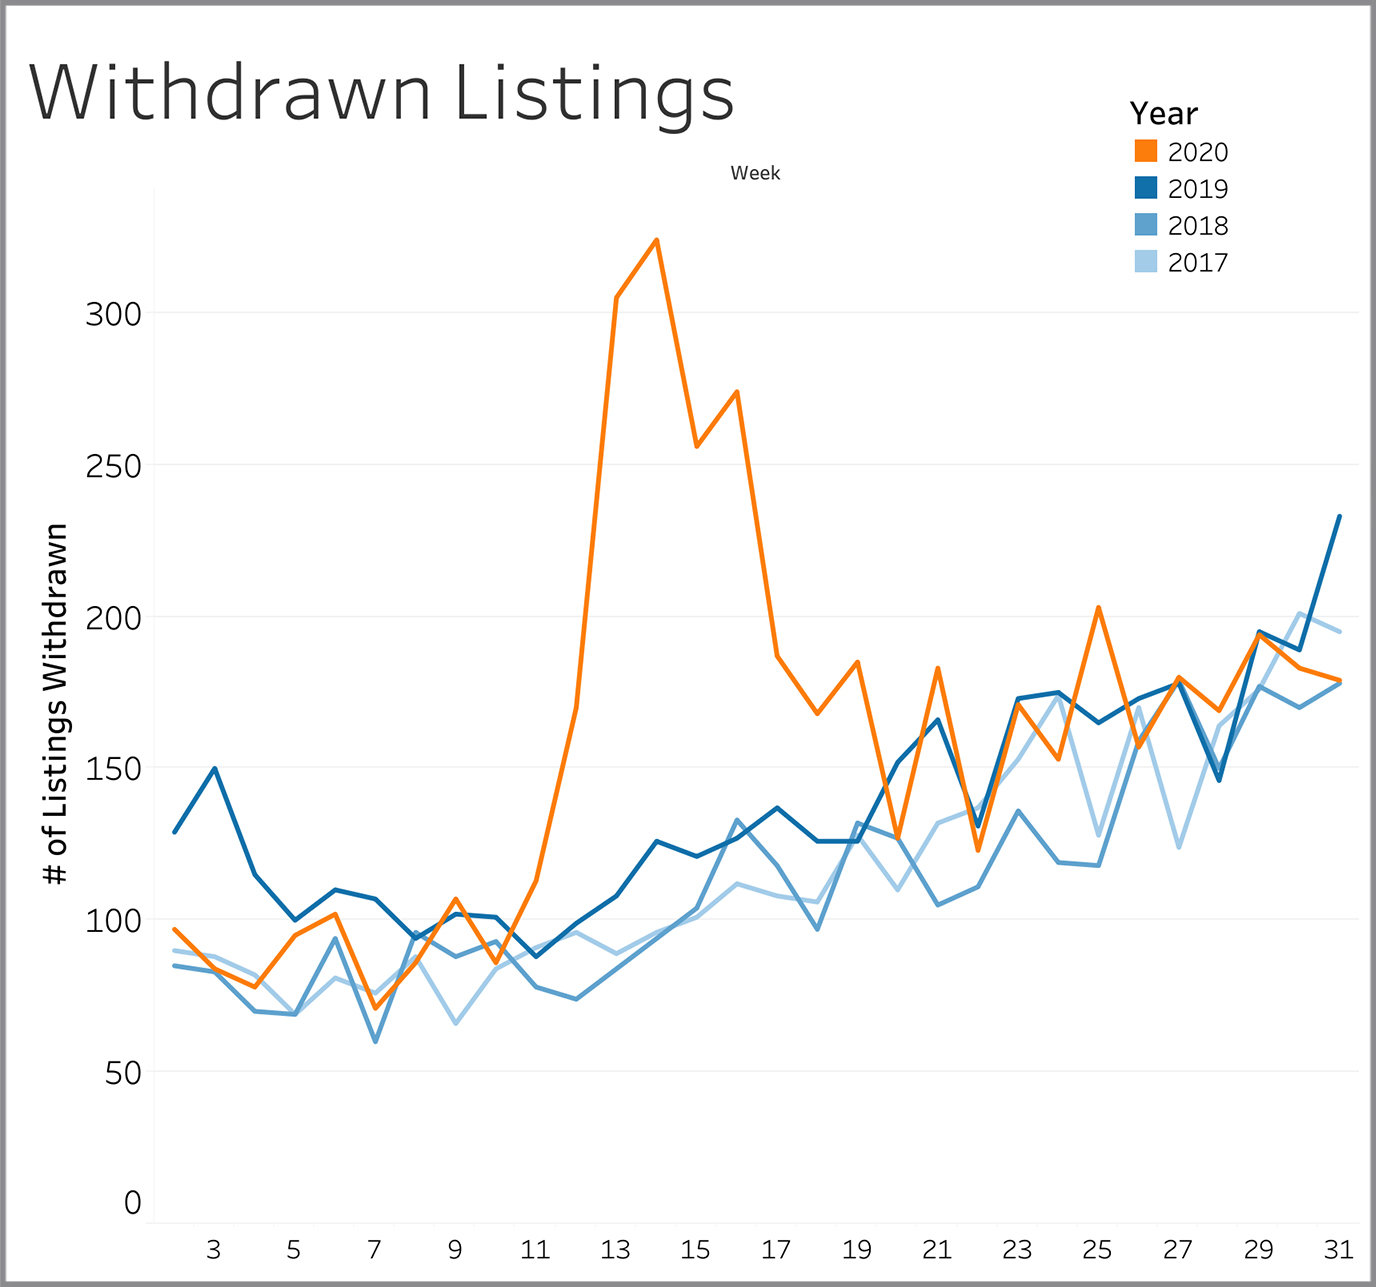
Withdrawn Listings
Withdrawn listings are sellers that have either given up altogether on selling or that have temporarily halted showings. The number for Week 31 matches what we saw in 2018 and if lower than both 2017 and 2019 levels.
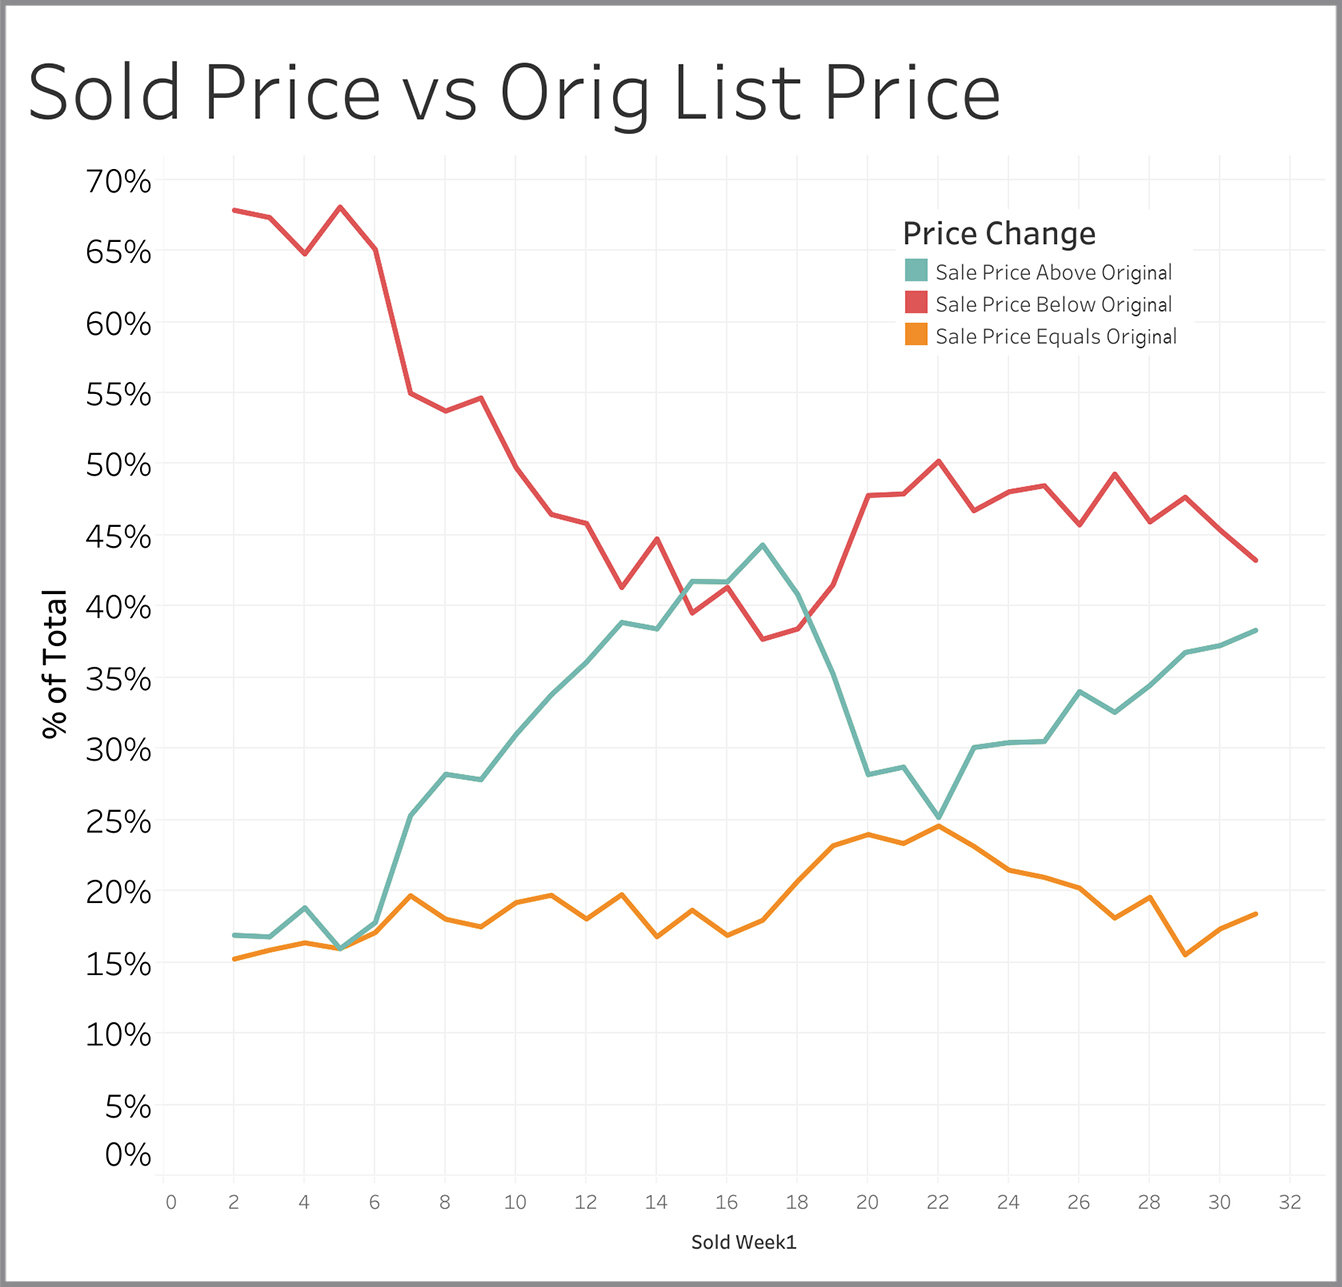
Sold Price vs. Original List Price
The pattern has been very consistent for the last ten weeks. Approximately 57% of sellers got at or above original asking price in Week 31.
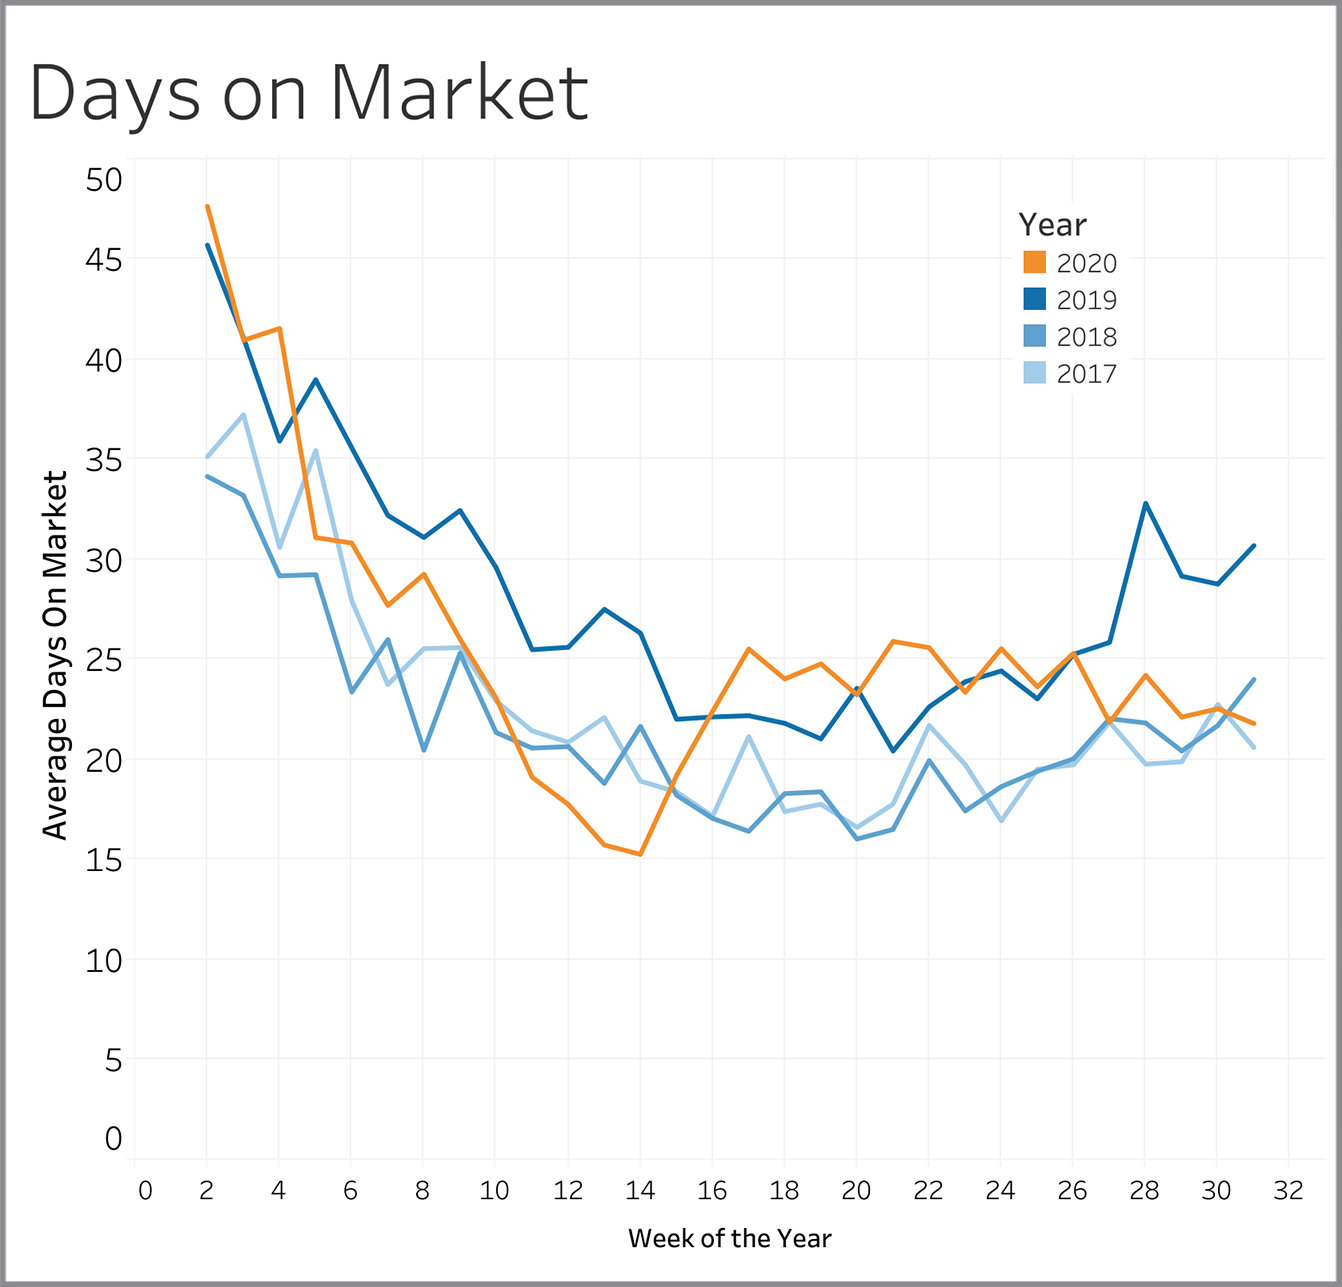
Days on Market
Days on market is measured from the time a property first comes on the market to when it goes under contract. At 22 days for Week 31, the number is consistent with 2017 and 2018 but running well below the levels seen in 2019.
Showings Per Listing - Compare Year
We saw this metric decline consistently after Week 10, but the pattern reversed in Week 17 and is now somewhat higher than levels seen in 2018 and 2019. While COVID would be expected to suppress showing activity, we see properties getting 1.5 to 2 more showings per week than in the two prior years.

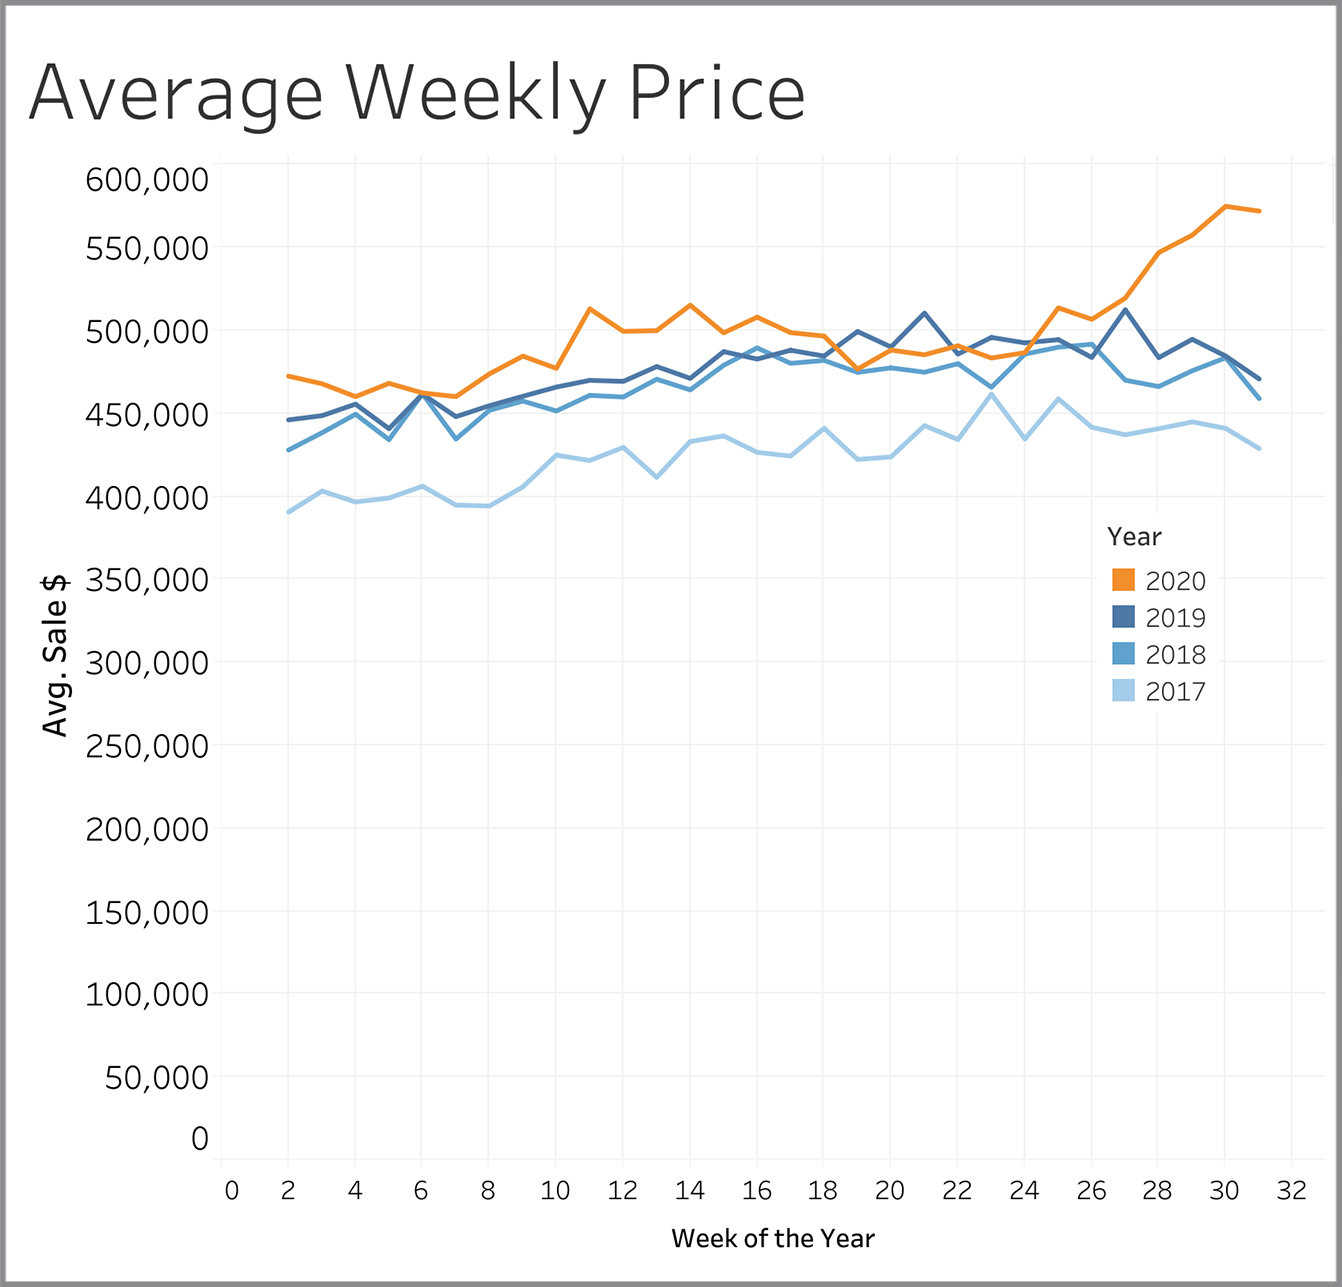
Average Weekly Price
The average price of properties closed in a given week reflects market conditions that existed about a month ago since it typically takes a month for a property to close once it goes under contract. Prices went flat and even declined a bit starting in Week 15, which is about a month after the first Stay at Home order was issued. They continued declining through Week 24, a pattern that is definitely counter to the generally rising price pattern over the same time frame in the three prior years. Prices have soared since Week 25 and now stand 21% higher than a year ago at this time.
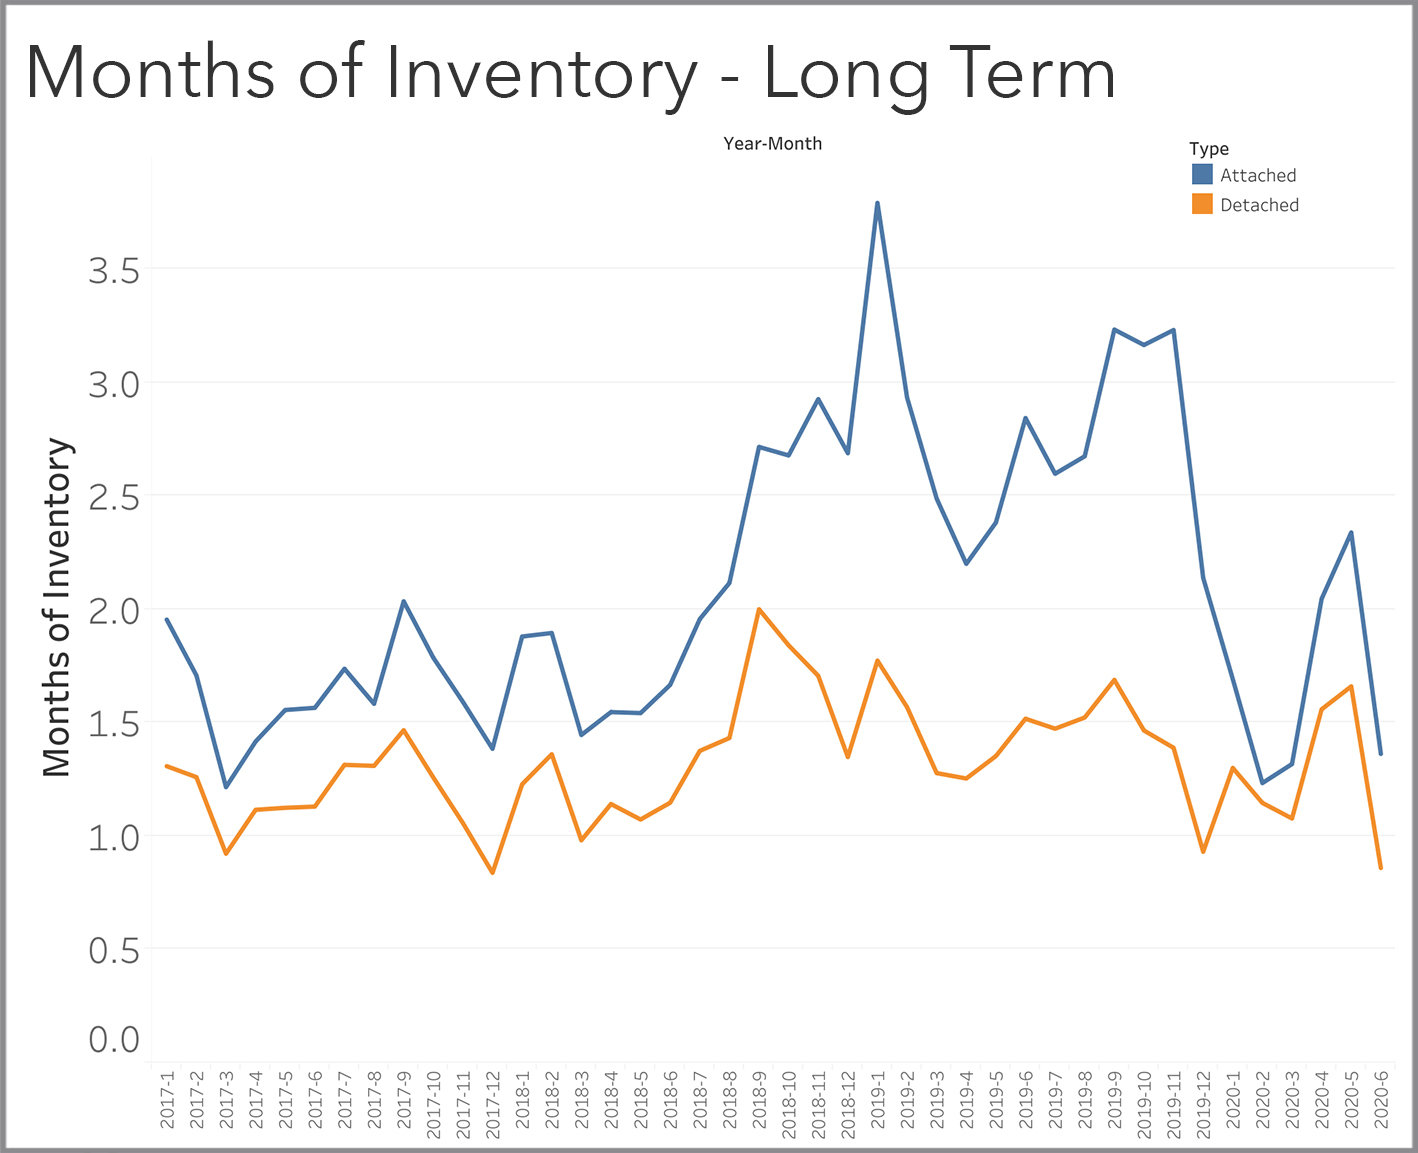
Months Of Inventory - Long Term
Months of inventory is computed by taking the rate at which homes are selling and dividing it into the number of homes available. It measures how long it would take to sell all the homes currently on the market if homes keep selling at the current rate. Anything less than 3 months is considered a seller’s market. The 0.86 months of inventory for detached single-family homes in June this year is the 2nd lowest value we’ve seen over the last 3½ year, eclipsed only by the 0.838 months of inventory in December 2017. The 1.363 months of inventory for attached single family homes (condos, townhouses, duplexes, etc.) is the 4th lowest value we’ve had in the last 42 months.
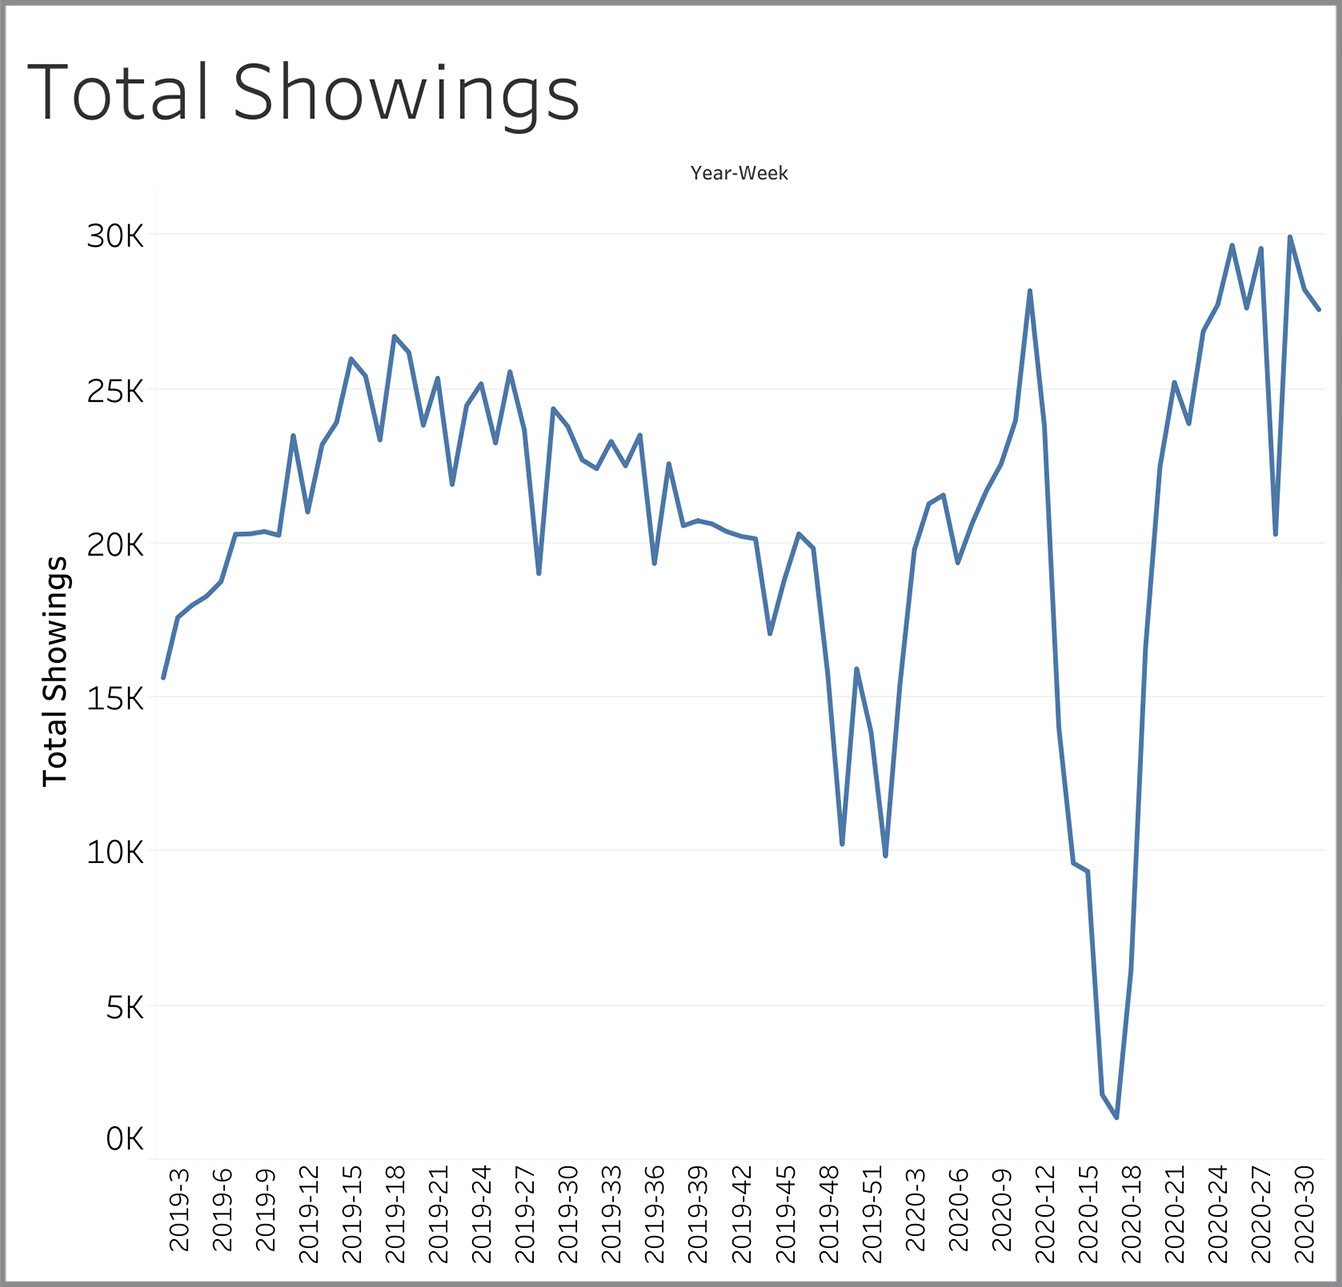
Total Showings
Total showings have hovered in the range of 27,500 to 30,000 over the last few weeks with the exception of Week 28, which was 4th of July weekend.
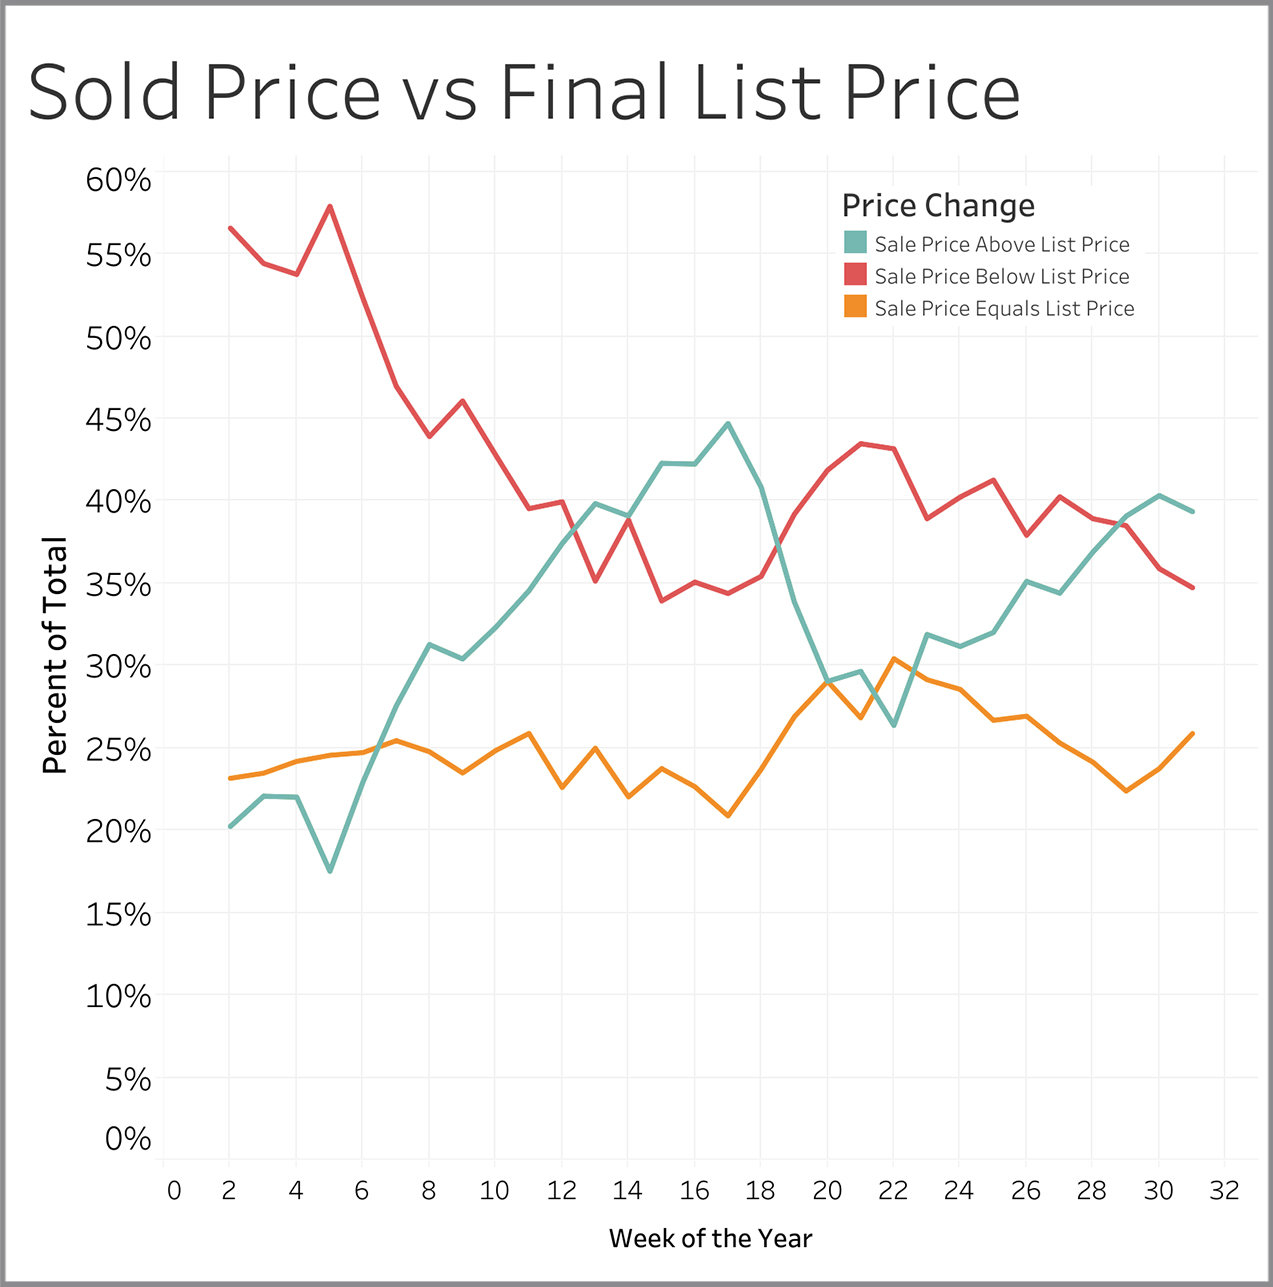
Sold Price versus Final List Price
Over the last few weeks, we’ve seen the number of sellers getting at or above their final asking price trend upwards from 55% to 65%.
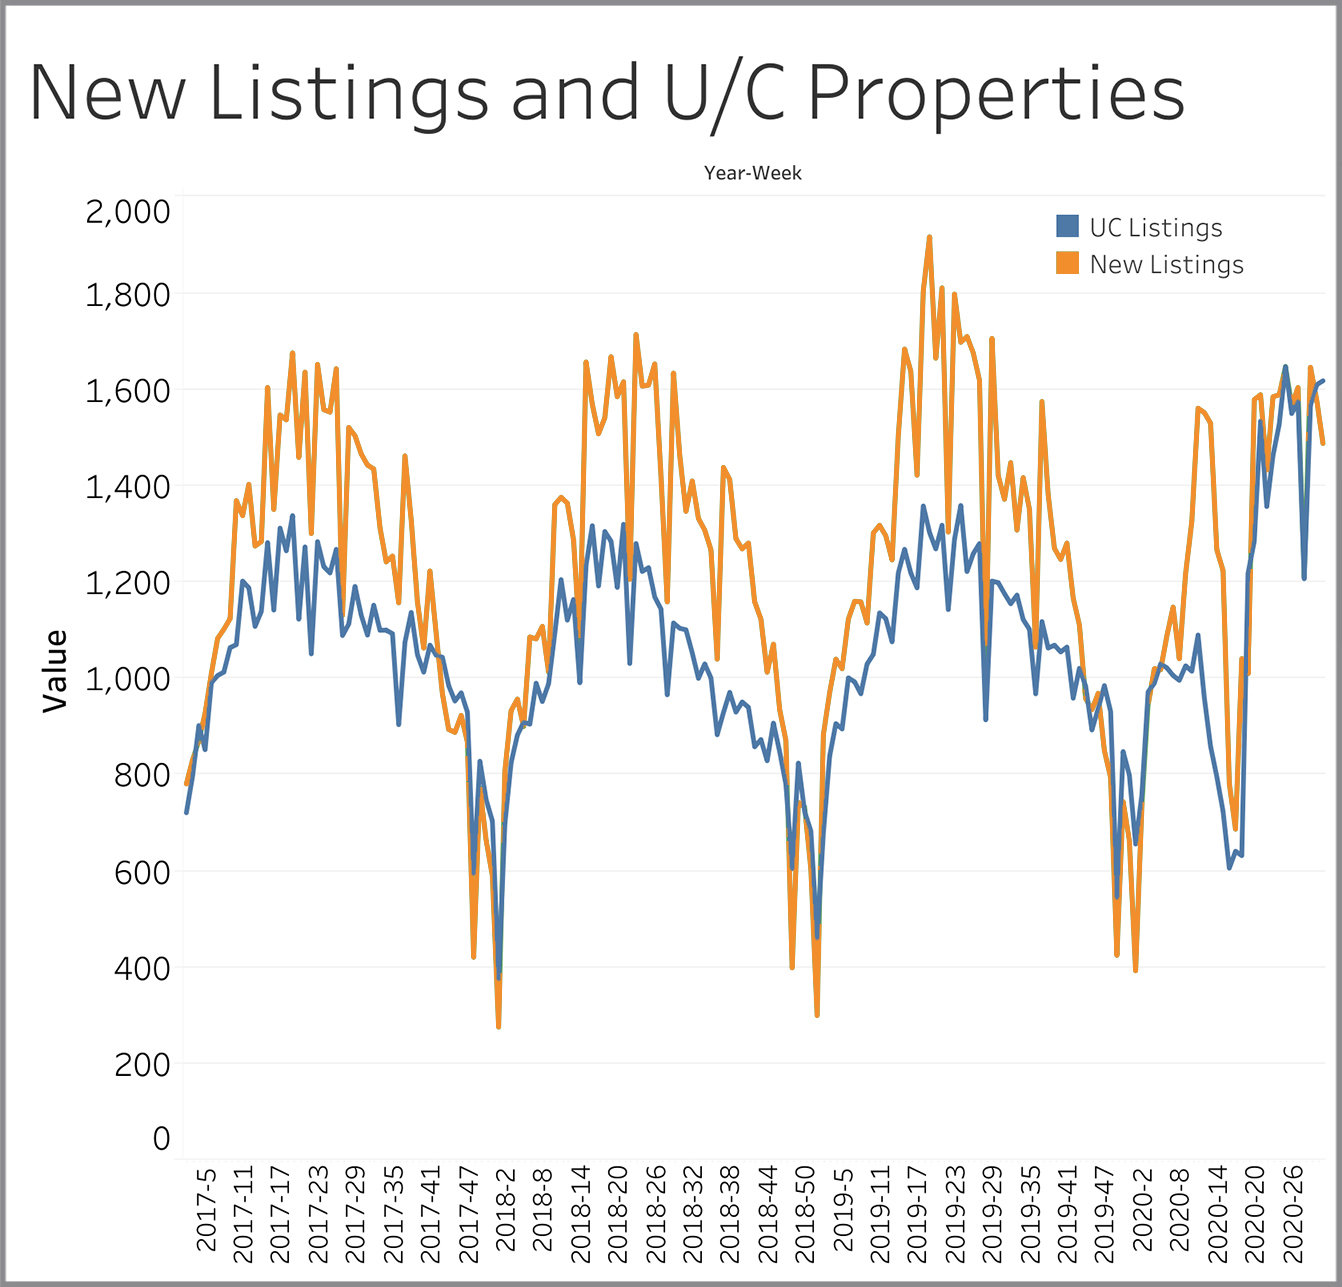
New Listings and Under Contract Properties
This chart makes it easy to see that the number of new listings every week has been closely matching the number of properties going under contract for the last 10 weeks.
