CHR STATE OF THE MARKET
Findings Through Week 24, 2020
Week 24 began on June 10th and ended on June 16th.
Driven by incredible demand and extremely low inventory levels, the Denver real estate market is as hot as it has ever been! 1,804 under contract homes outpaced 1,647 new listings for the first time ever at this time of year. 1,804 homes under contract in a week is by far an all-time Denver Metro market record and 39.3% higher than last week's 3-year average of 1,295 homes. The average weekly sales price in Denver was up over $33,000 last week alone, hitting an all-time high of $520,083!
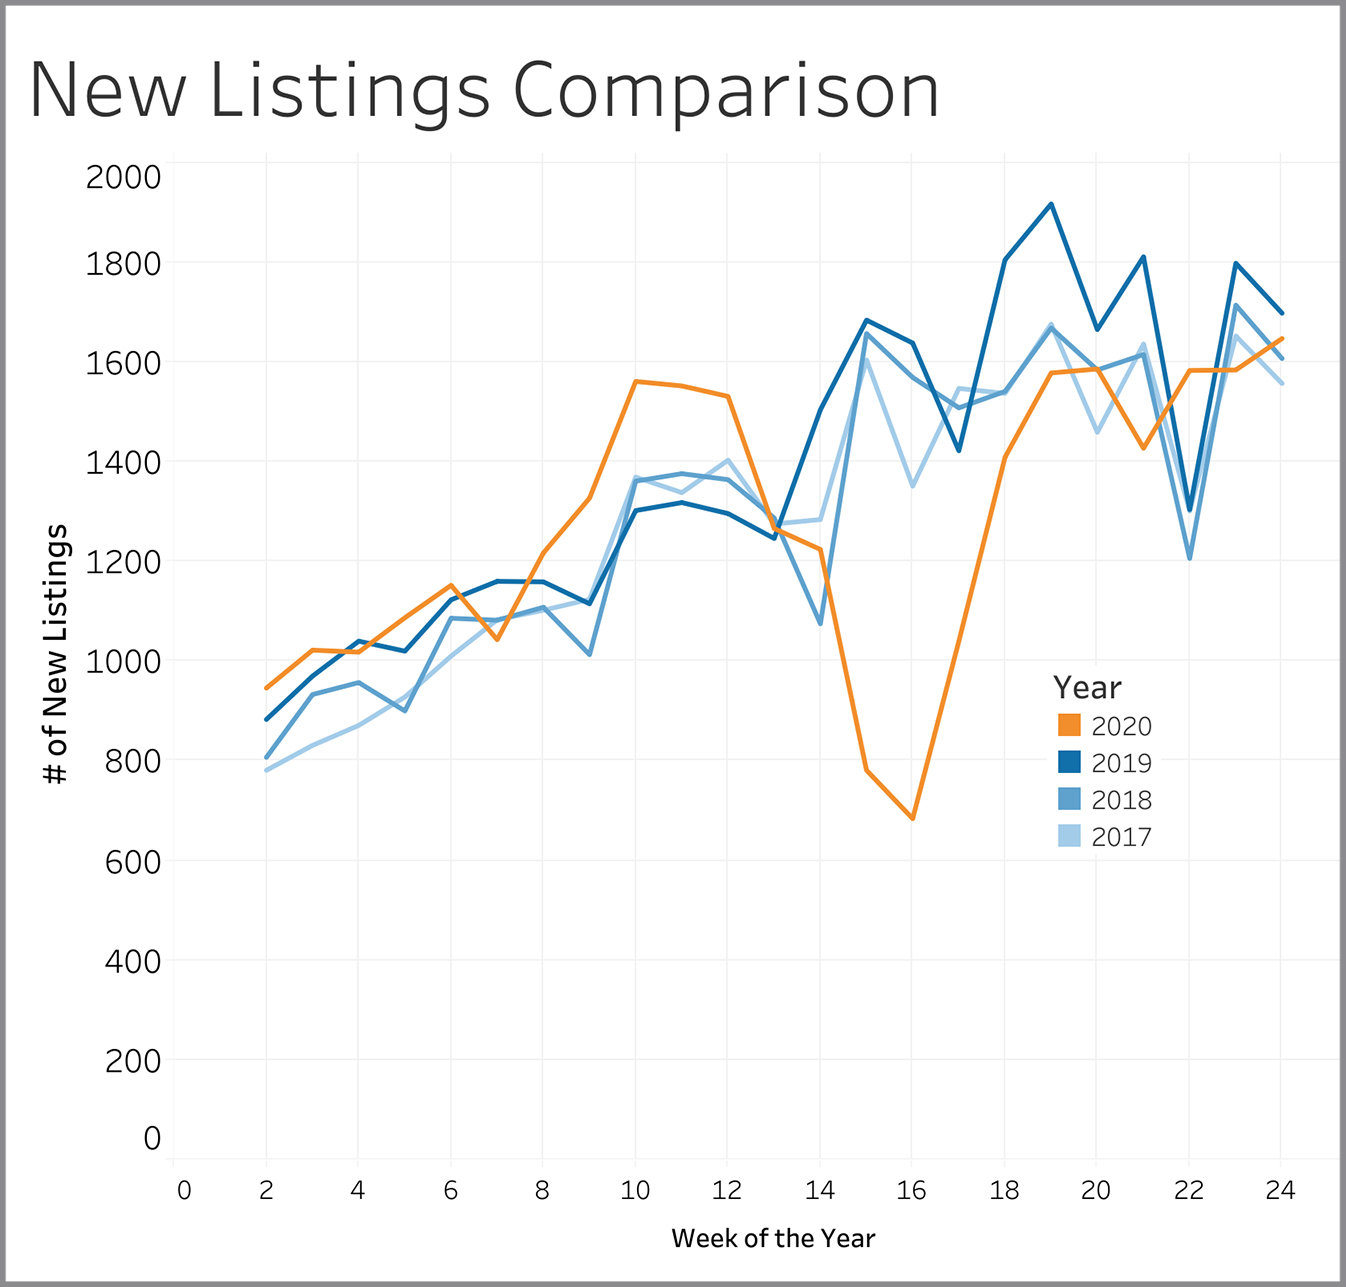
New Listings
New listings reflect seller attitudes on whether this is a good time to be selling. The number of new listings hitting the market have returned to normal levels for this time of year.
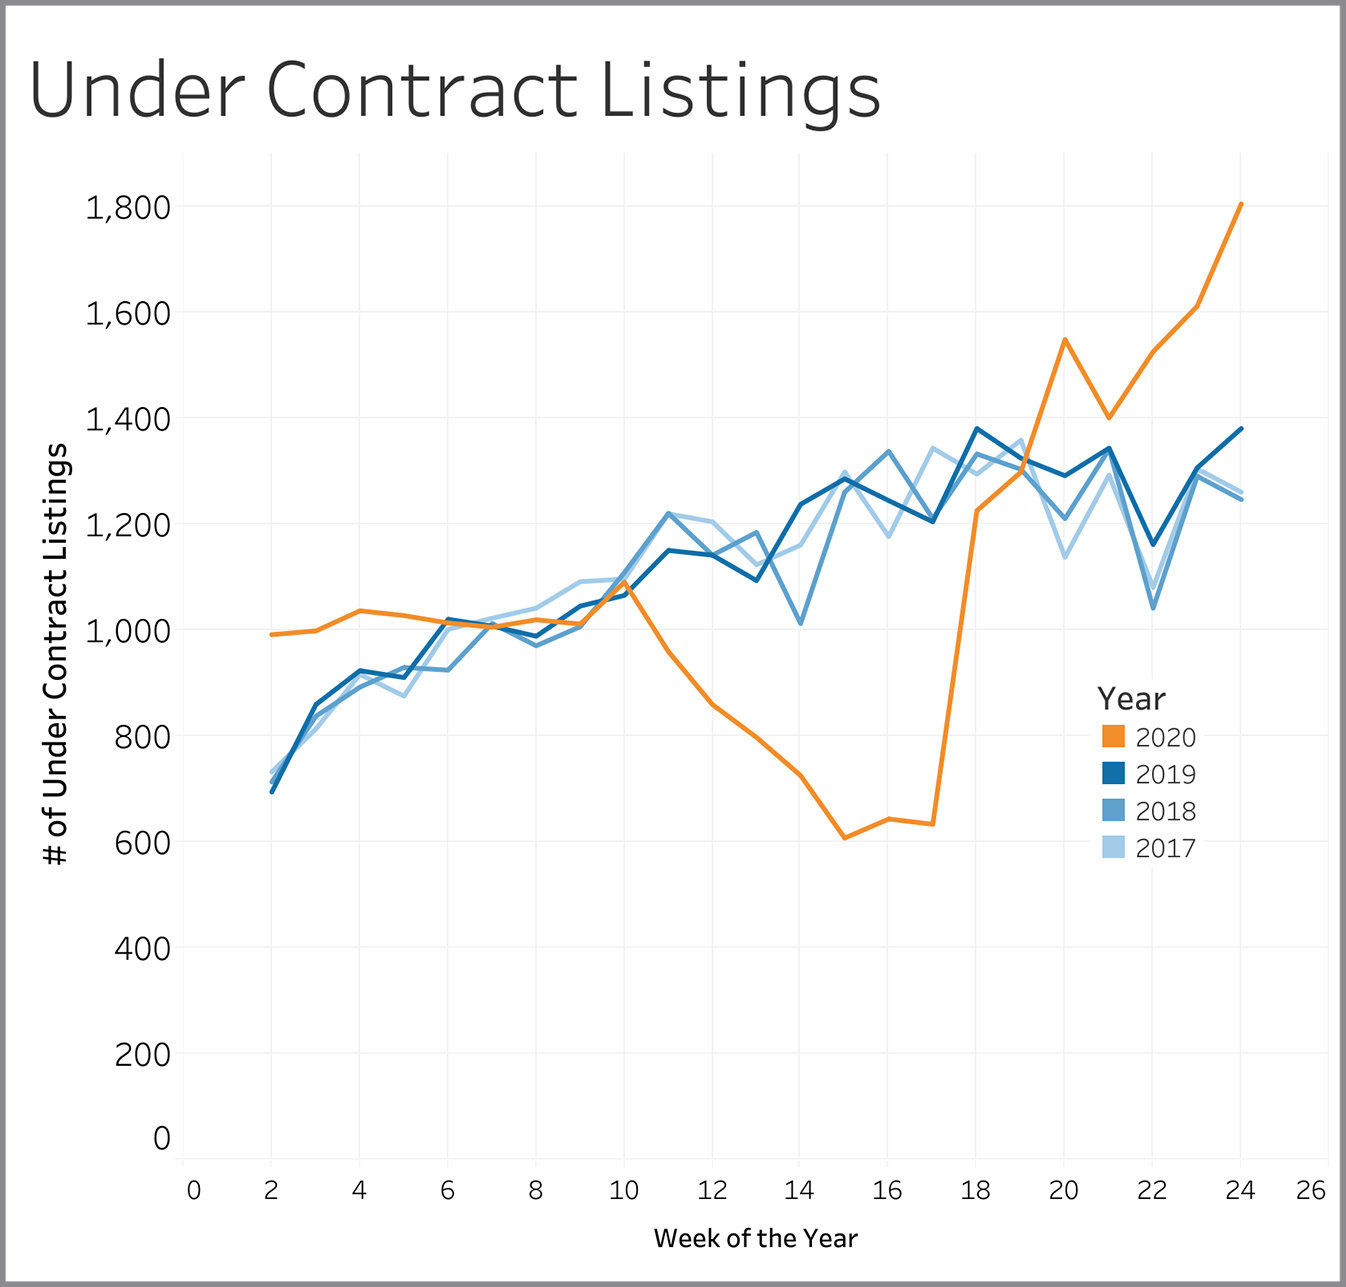
Under Contract Listings
Properties going under contract show us whether buyers are confident to do business in the current market environment. We’ve seen this number surge significantly since Week 20 with numbers greatly in excess of the norm for June. Buyers are out in droves.
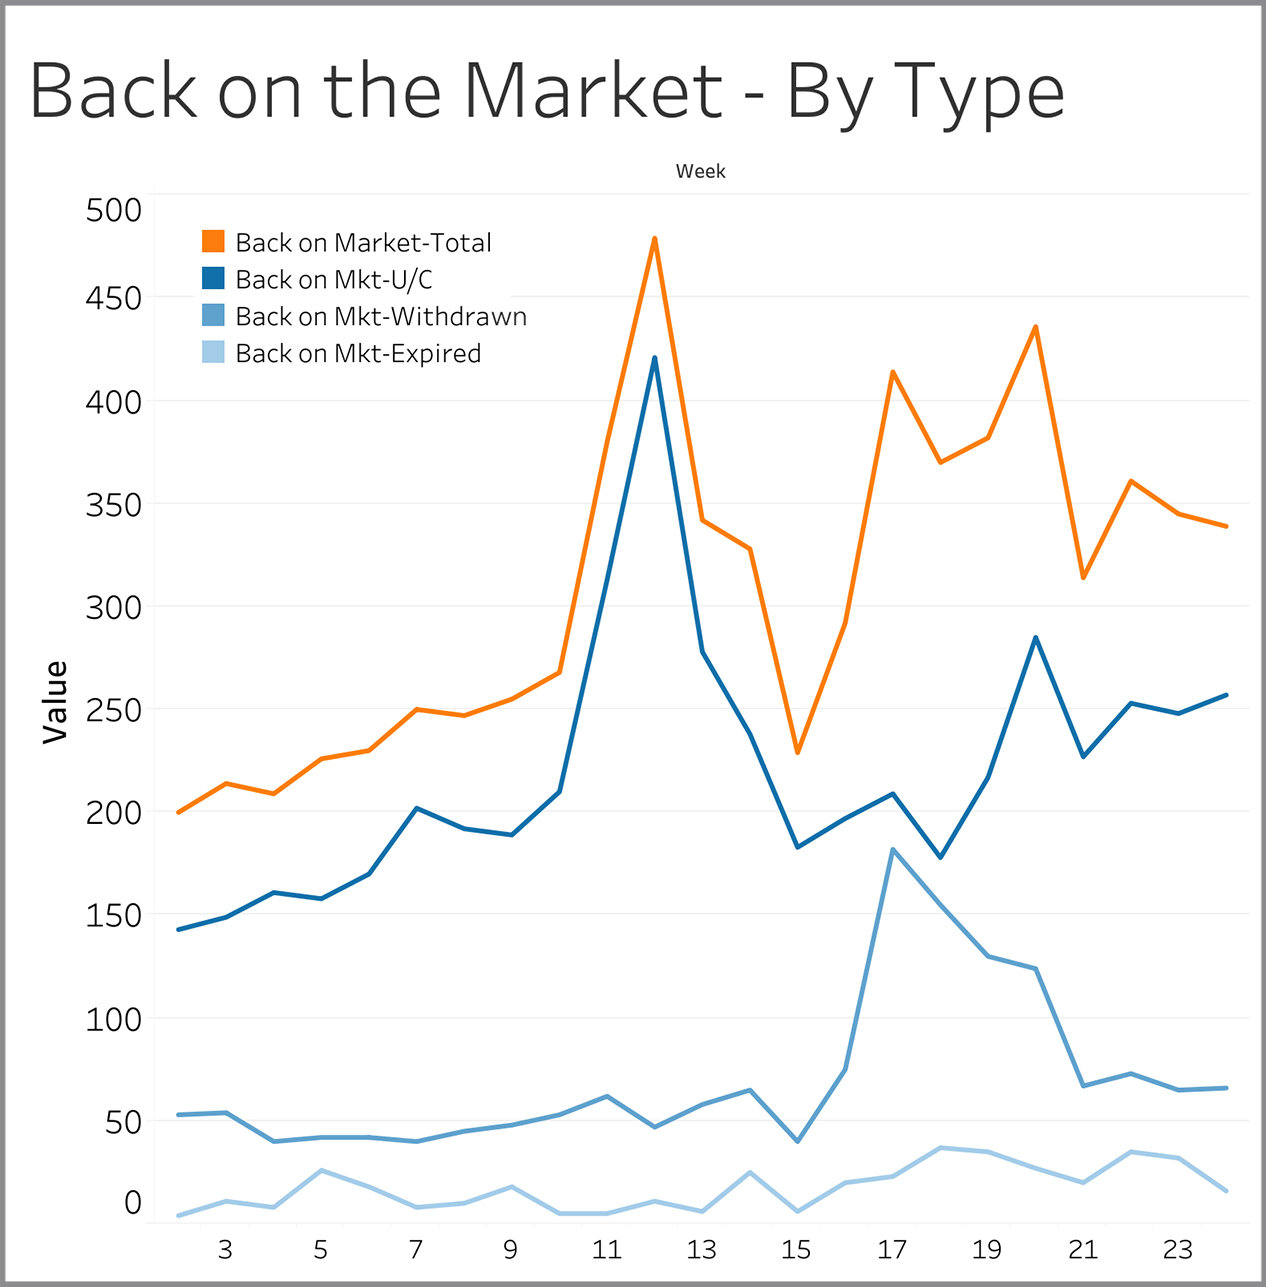
Back on Market – By Type
Listings come back on the market for three reasons: (1) Seller lost a deal with one buyer and are now looking for another one; (2) Seller took a break from showing the property and is now allowing showings again; (3) Seller let his/her listing expire and then came back to the market within 30 days with either the same agent or a different agent. Losing a buyer accounted for almost 75% of the properties coming back to the market in Week 24. The overall number of homes coming back on the market was around 340 and that is very close to the 310 to 315 in Week 24 of the the three prior years (data for prior years not shown on this chart).
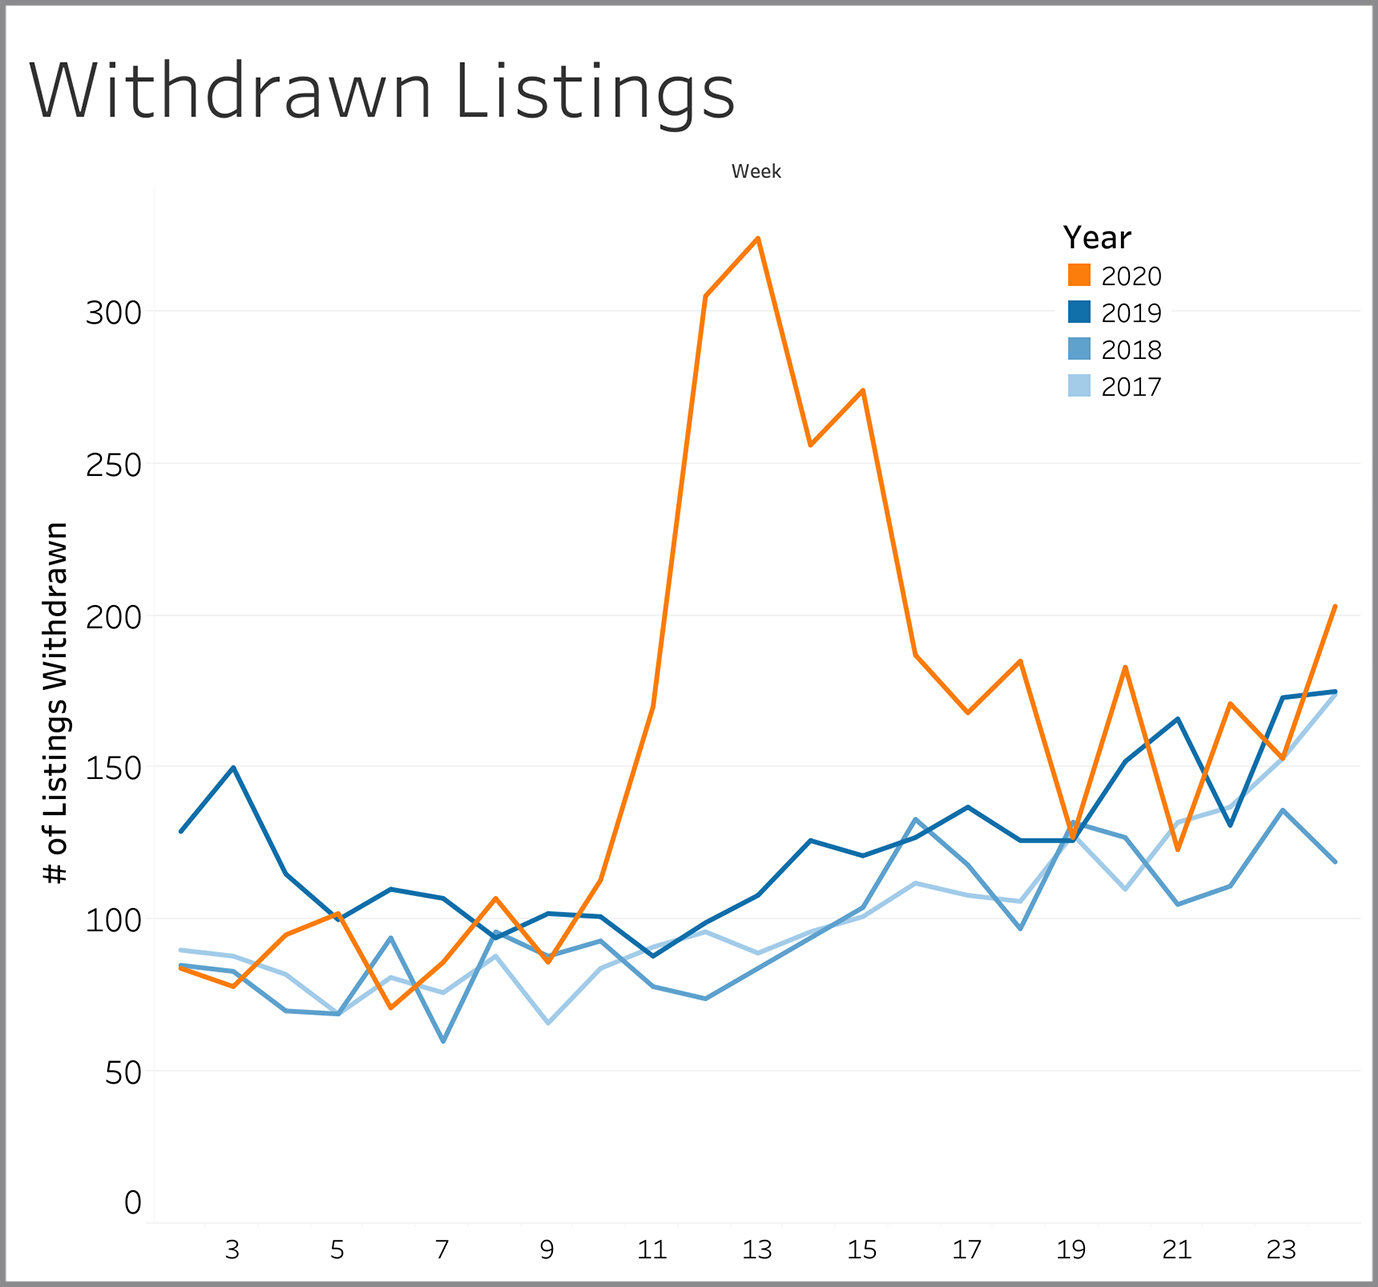
Withdrawn Listings
Withdrawn listings are sellers that have either given up altogether on selling or that have temporarily halted showings. The overall pattern has been for this number to be either slightly above or slight below levels seen in 2018 and 2019.
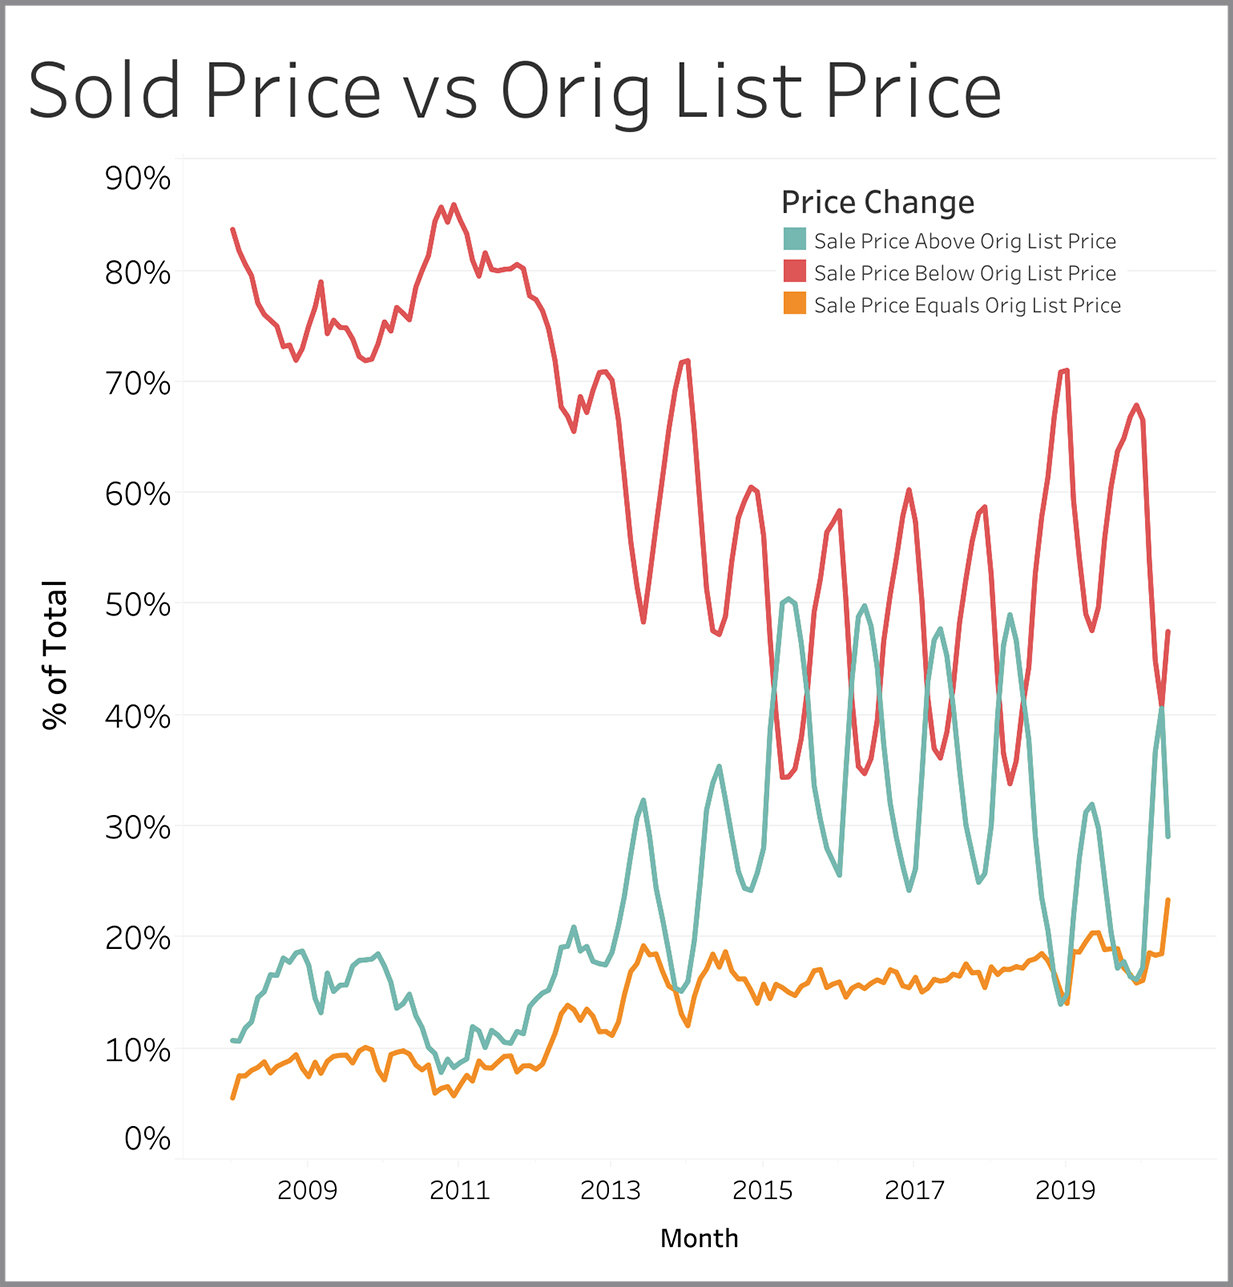
Sold Price vs. Original List Price
For the last few weeks, it has been a 50/50 split on this metric. Half of the sellers are getting at or above original asking price and the other half get something less than full price.
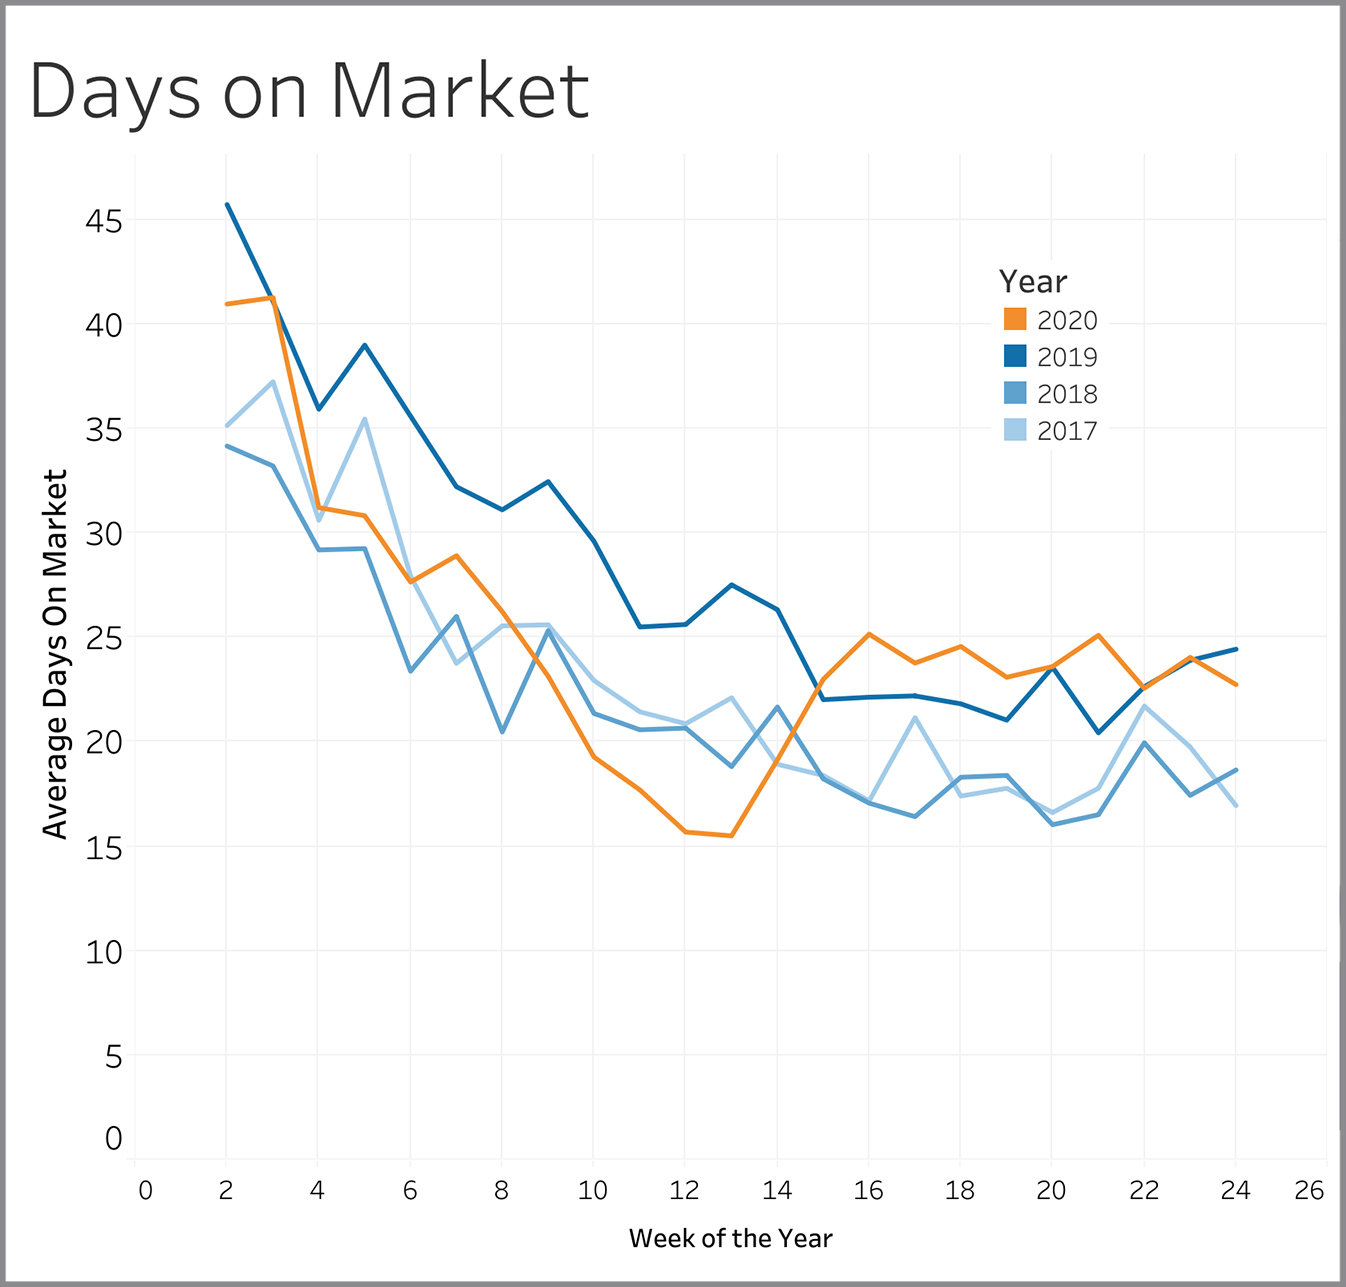
Days on Market
Days on market is measured from the time a property first comes on the market to when it goes under contract. For the last nine weeks, the number of days it takes to find a buyer has been in the 23 to 25 day range and that is very comparable to what was experienced in 2019.
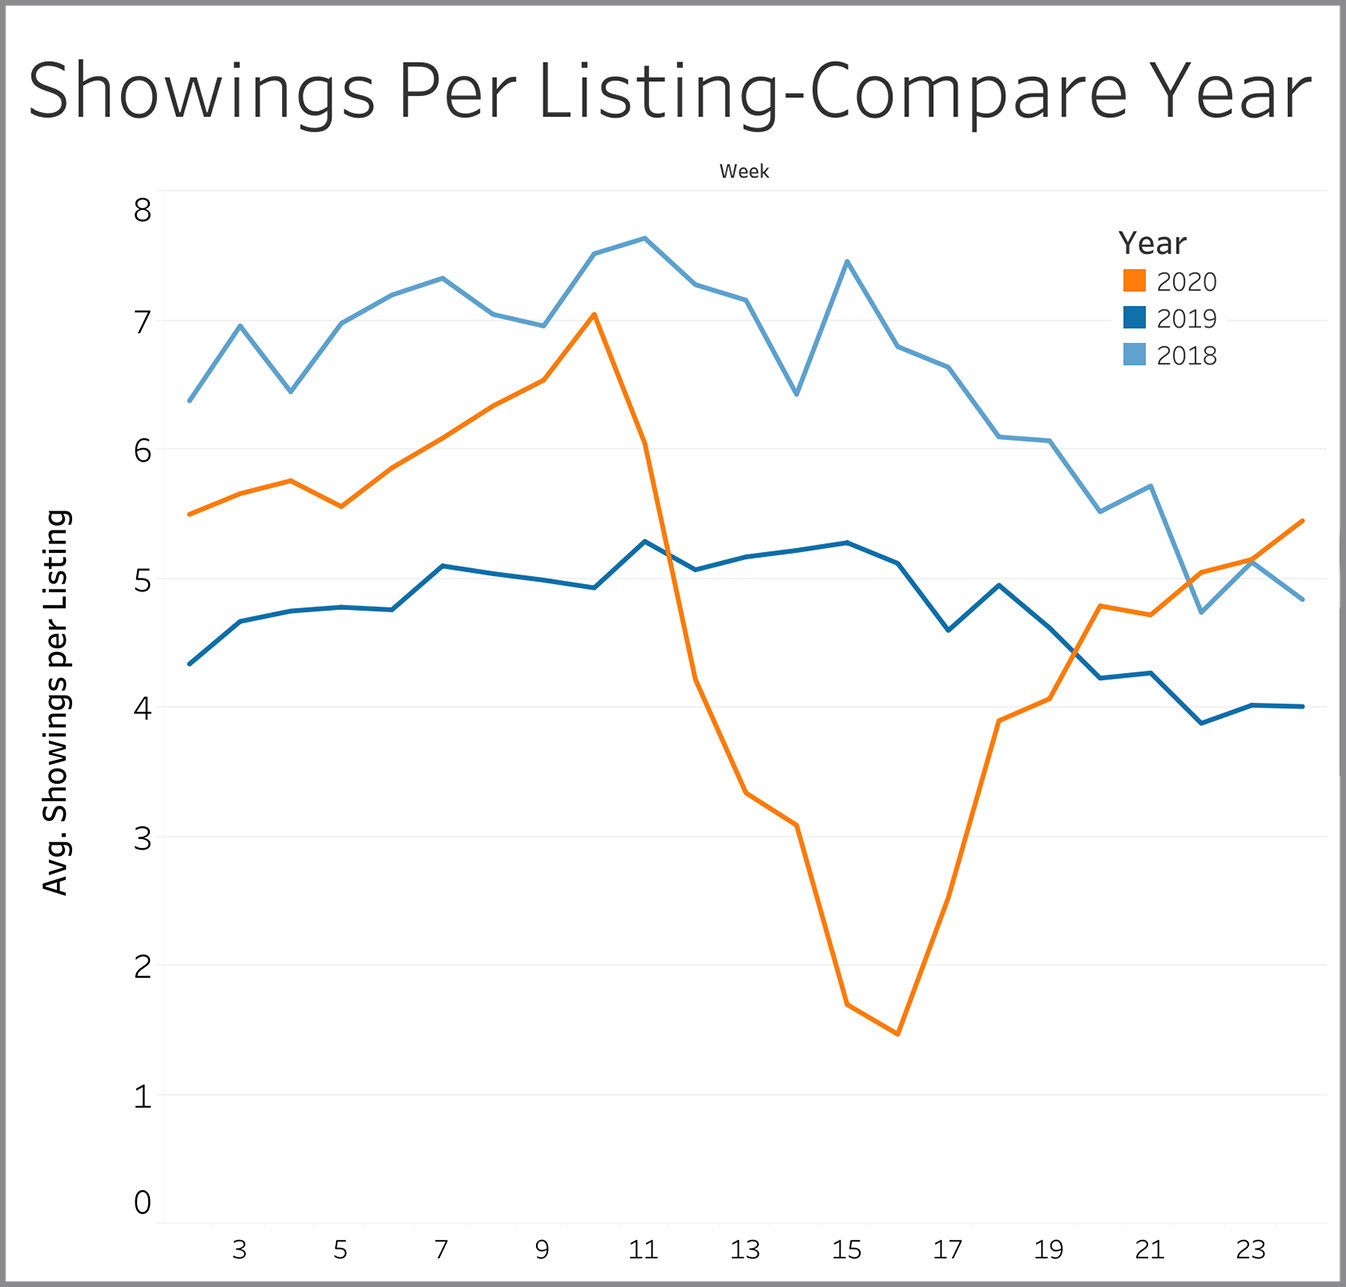
Showings Per Listing - Compare Year
We saw this metric decline consistently after Week 10, but the pattern reversed in Week 17 and is now somewhat higher than levels seen in 2018 and 2019.
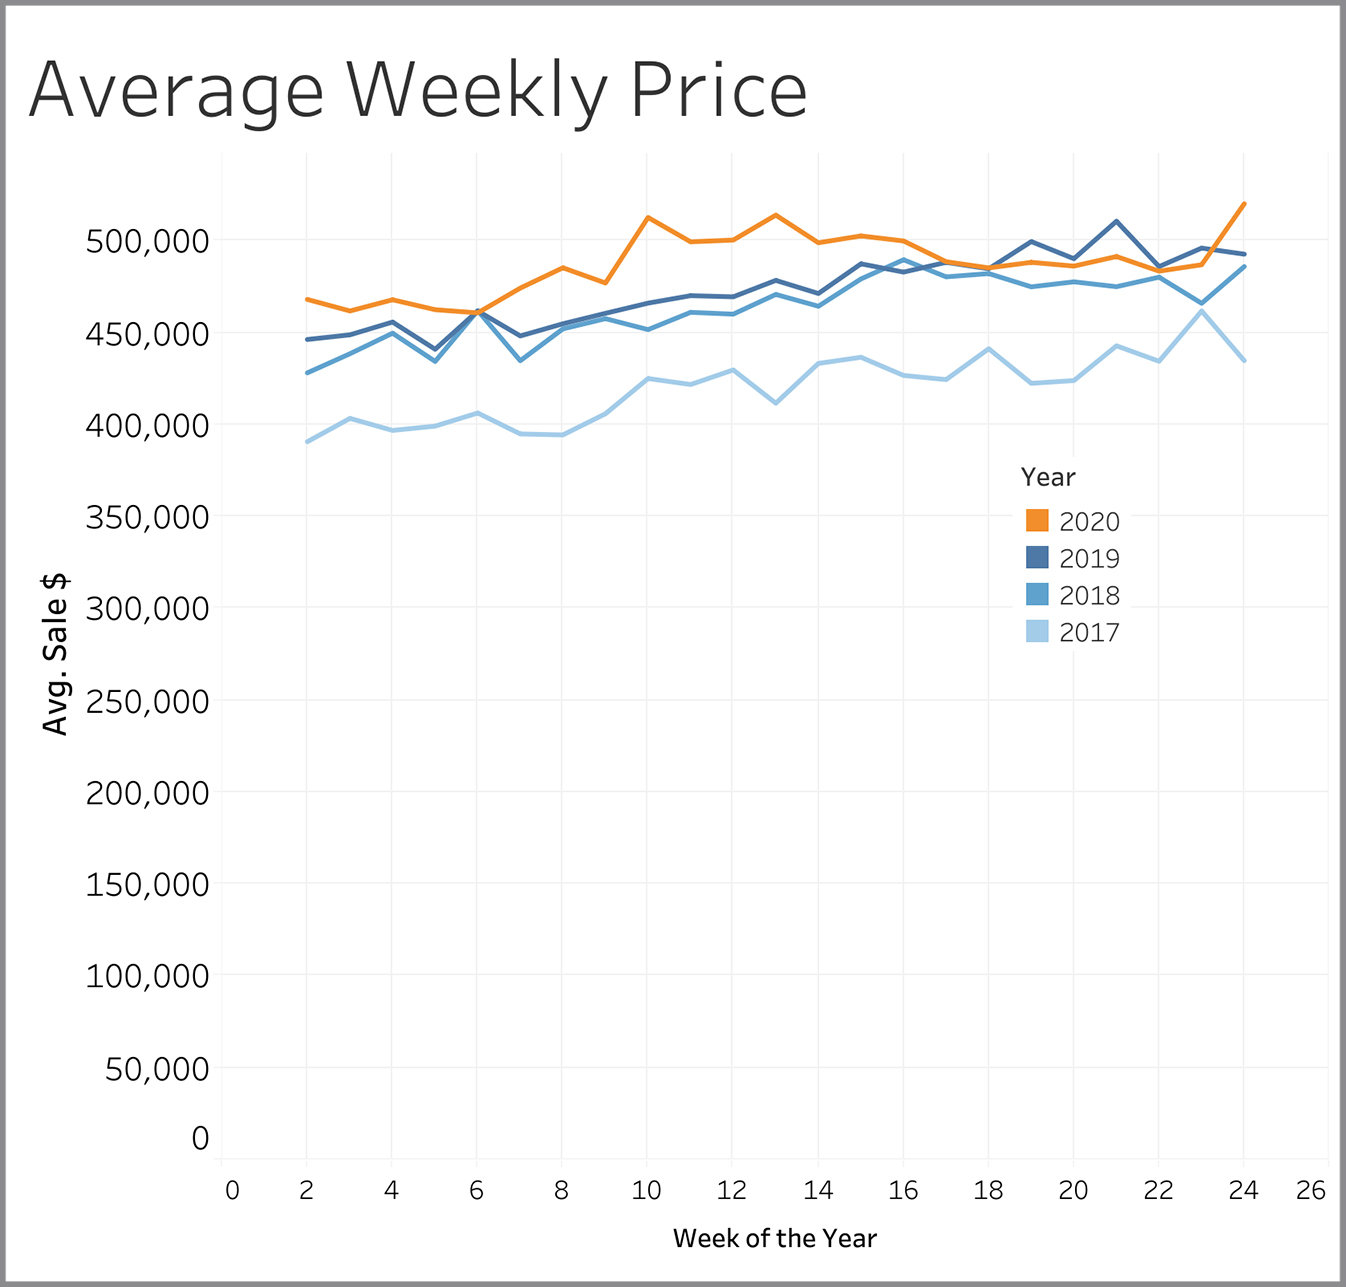
Average Weekly Price
The average price of properties closed in a given week reflects market conditions that existed about a month ago since it typically takes a month for a property to close once it goes under contract. Week 12 is when the first Stay at Home order was issued, and it is Week 16 (a month later) where the average price seems to start falling a bit. Stay at home restrictions started easing in Week 17 and showings were back at normal levels by Week 19. Now five weeks later, it appears that the average price has returned to the pattern of early in the year where it was running above 2019 levels.