CHR WEEKLY
Findings Through Week 18, 2020
Sellers came flooding back into the market in Week 18 and buyers responded in record numbers, resulting in the greatest number of homes going under contract in a single week so far this year. In-person showings continue to rise and days on market remain low. Almost 6 out of 10 homes are selling at or above their original asking price.
Note: The weeks shown in the charts below begin on Wednesday and end on Tuesday. Week 18 was from April 29th thru May 5th.
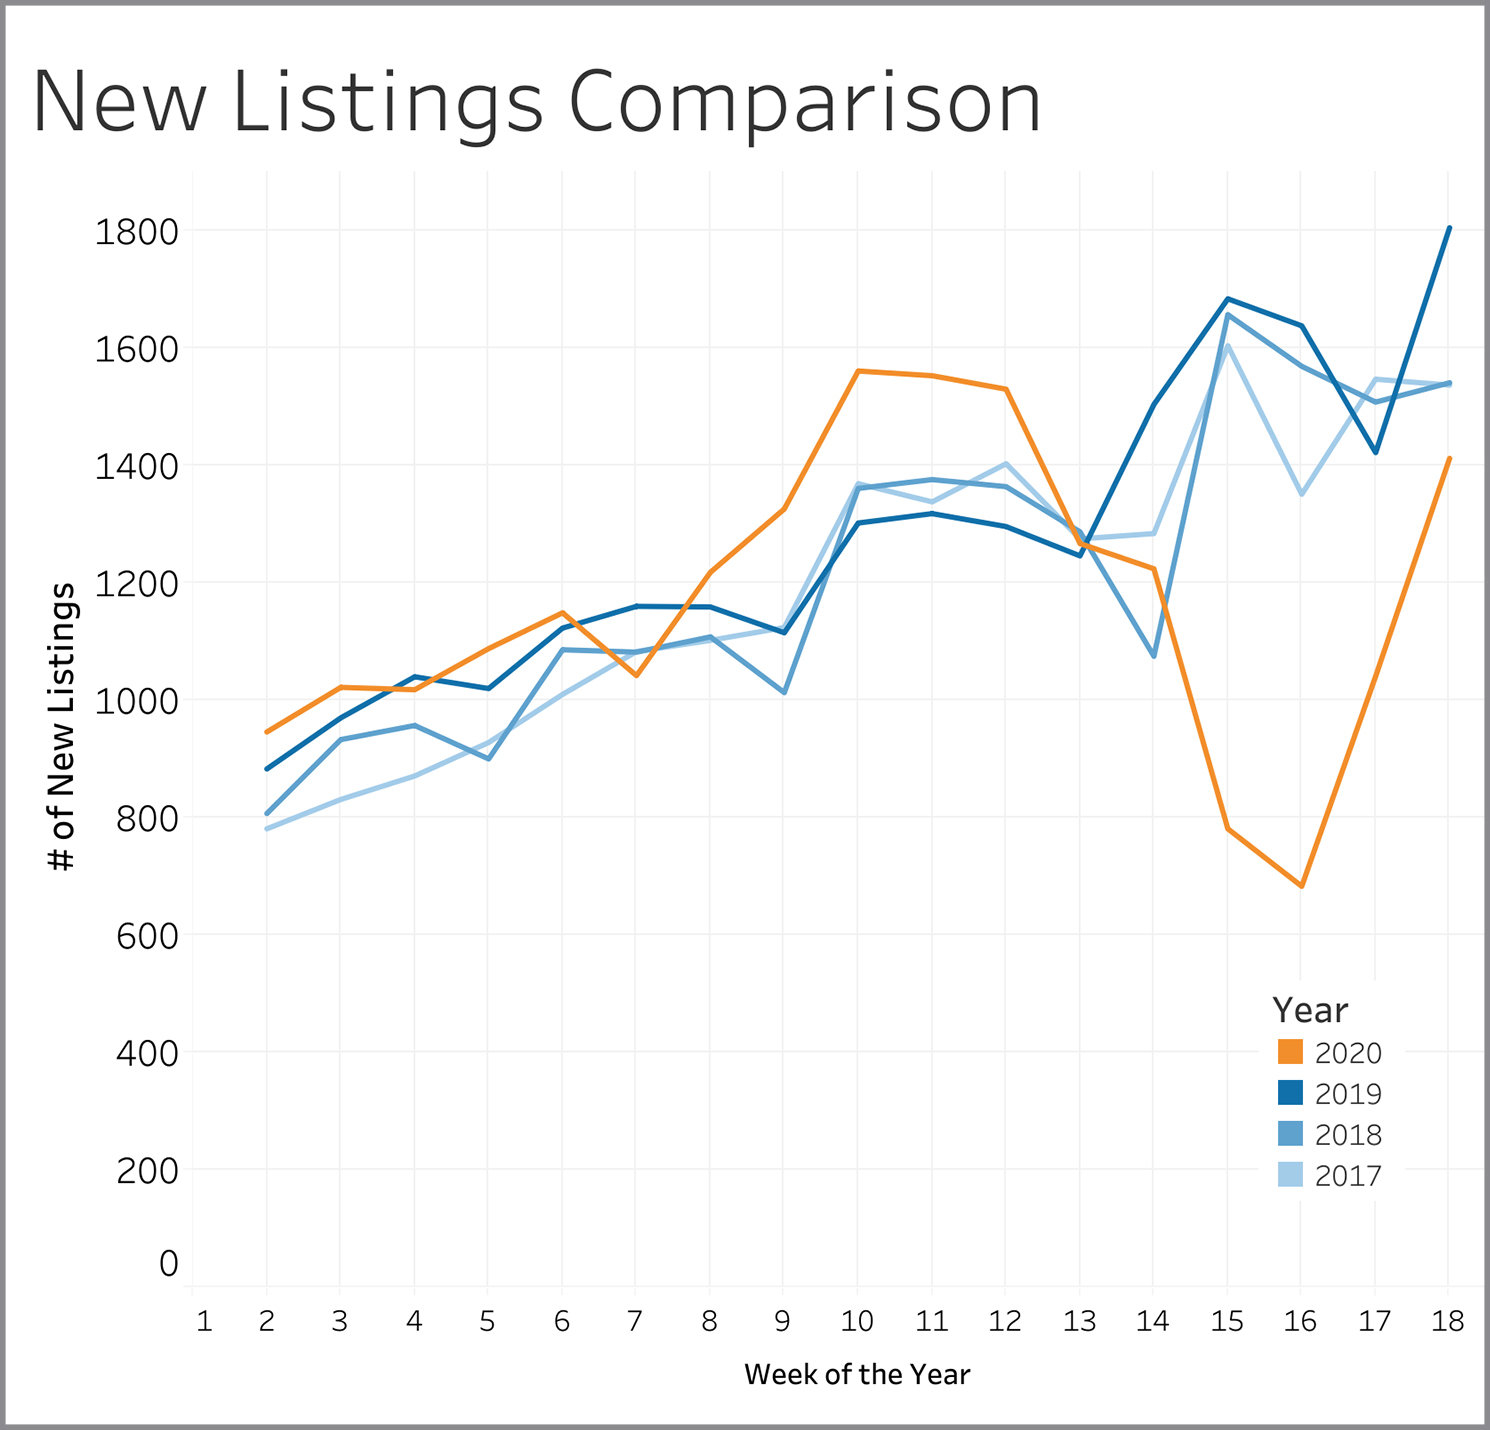
New Listings
New listings indicate the confidence sellers have in getting the process started. New listings fell sharply below typical levels in Weeks 13 through 16 and this coincided with confusion over what was and was not allowed in regard to real estate transactions in general and the showing of homes in particular. The last two weeks have seen the number of new listings return to near normal levels as the muddle over showings has gradually been clarified. A few metro Denver counties still had some showing restrictions during Week 18 and those are set to expire May 8th.
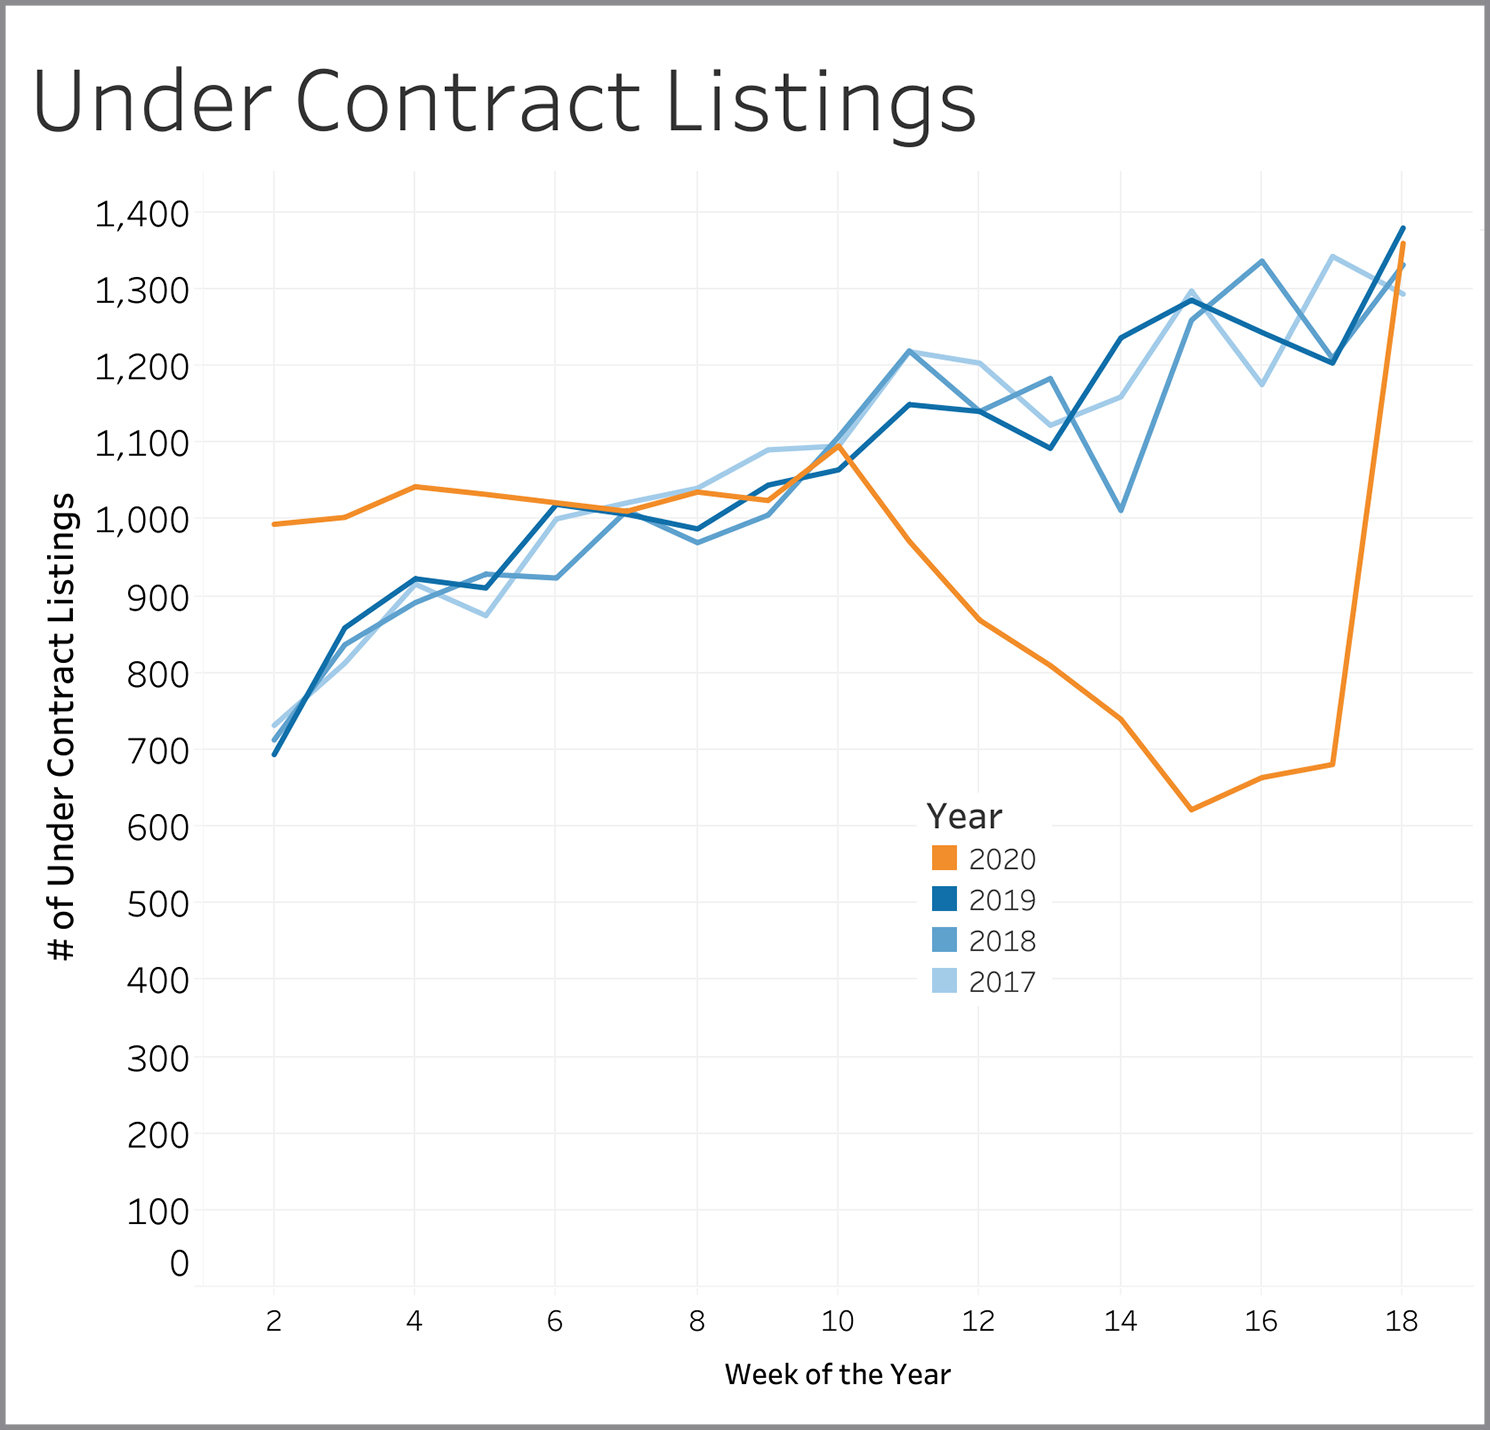
Under Contract Listings
Properties going under contract show us whether buyers are confident to do business in the current market environment. The number of homes going under contract fell predictably in Weeks 10 through 15 as fewer homes came on the market during that time frame. With a big surge in new listings in Week 18, buyers got busy again, coming out in droves and snatching up the new offerings. The result? The number of homes going under contract in Week 18 are at or above levels seen in the three prior years.
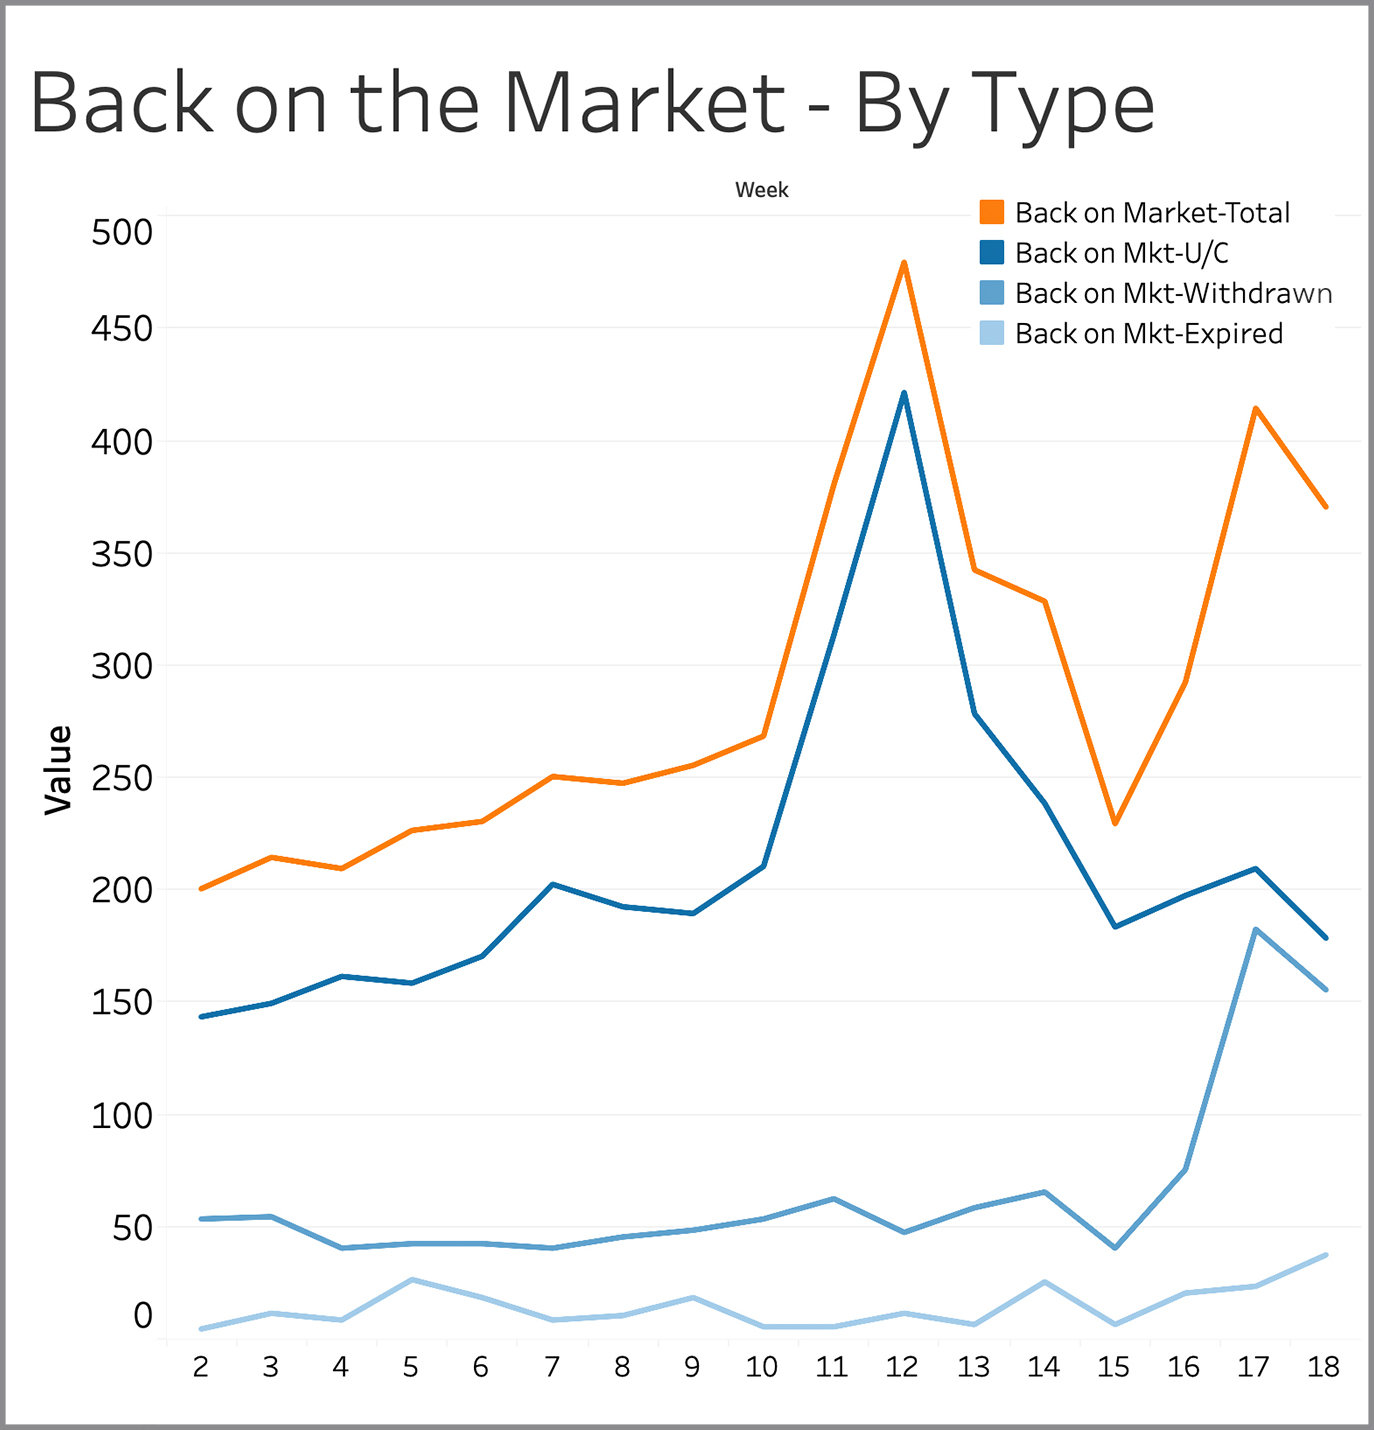
Back on Market – By Type
Listings come back on the market for three reasons: (1) Sellers lost a deal with one buyer and are now looking for another one; (2) Sellers took a break from showing the property and are now allowing showings again; (3) Sellers let their listing expire and then came back to the market within 30 days with either the same agent or a different agent. In the last two weeks, most of the homes coming back to the market are not due to sellers having lost a buyer (Reason #1) but from sellers returning to active marketing after taking a break (Reason #2). This is consistent with the increased clarity in the last two weeks about in-person showings being acceptable.
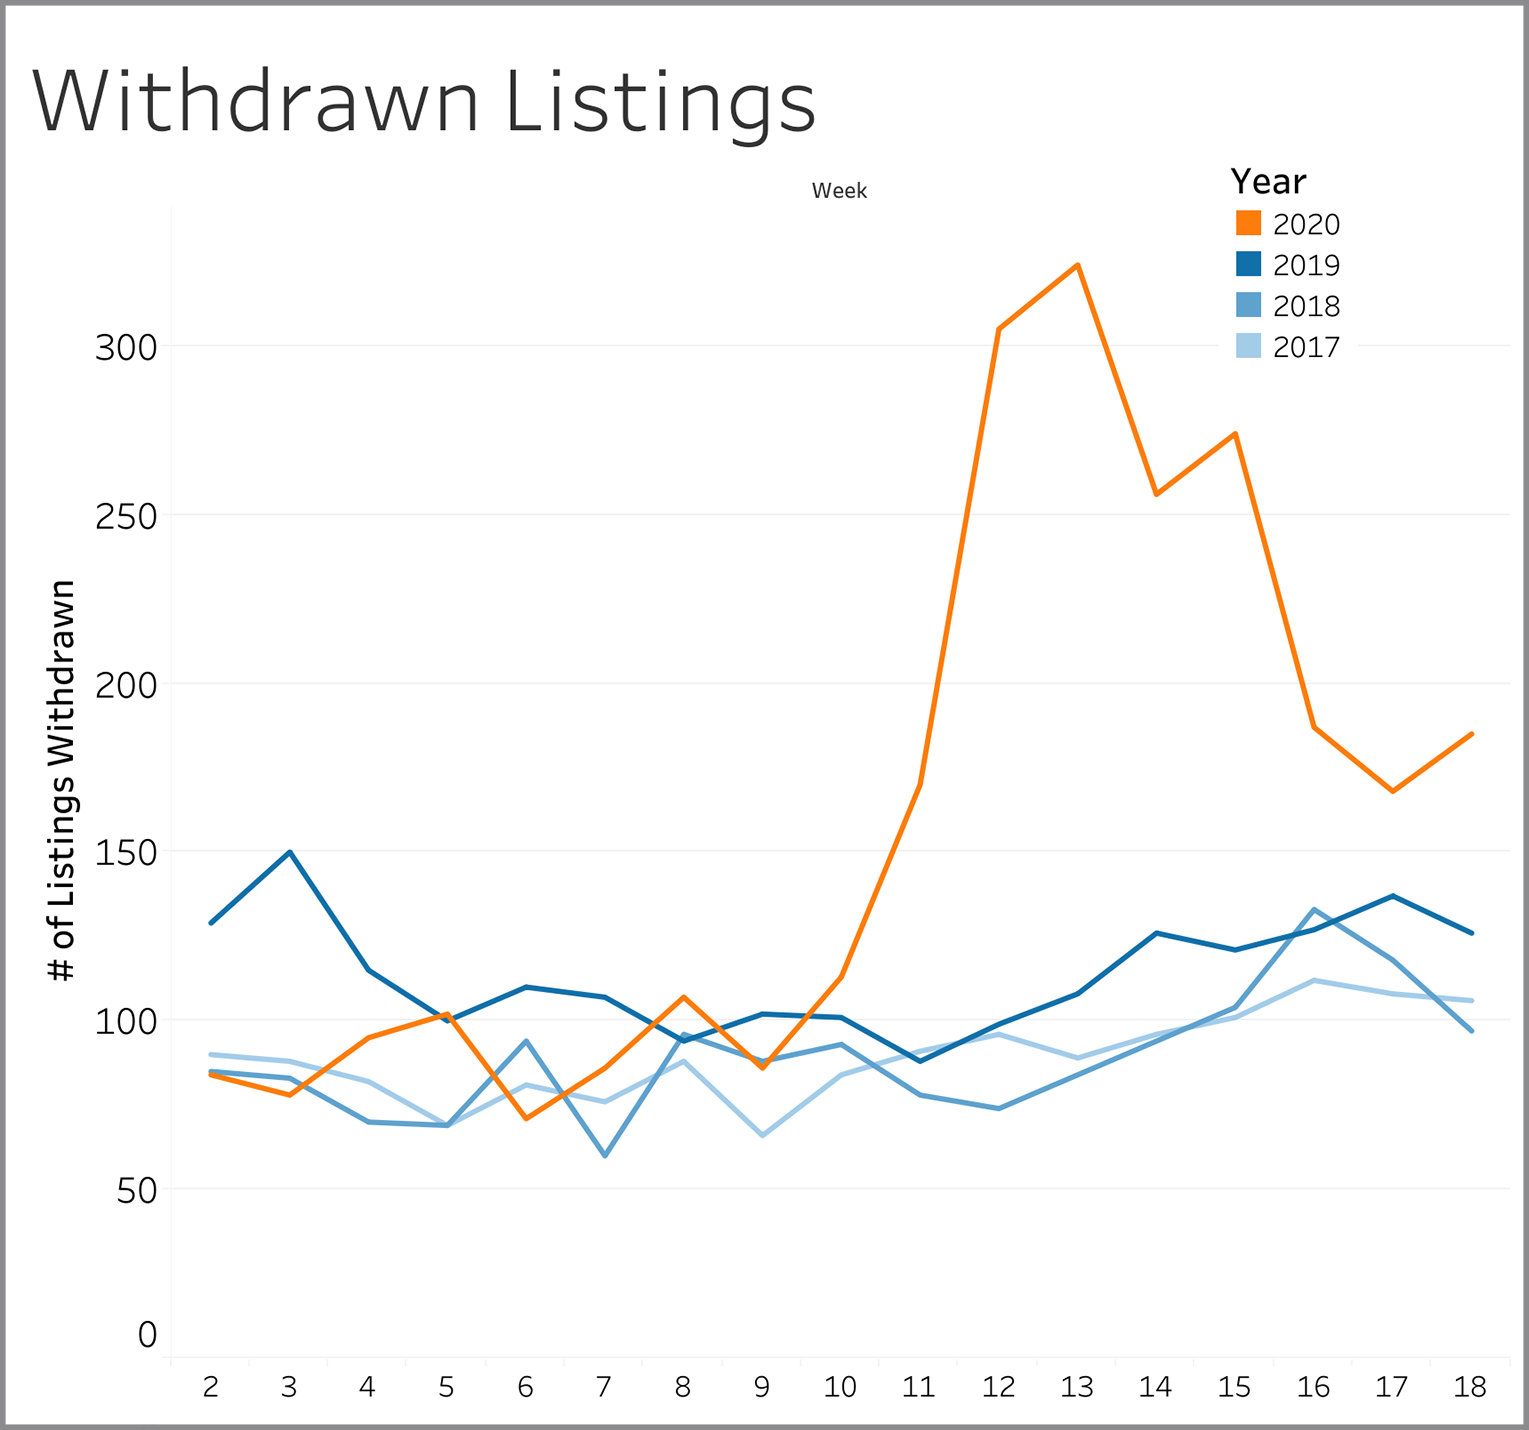
Withdrawn Listings
Withdrawn listings are sellers that have either given up altogether on selling or that have temporarily halted showings. After spiking significantly, the numbers are trending back towards normal levels.
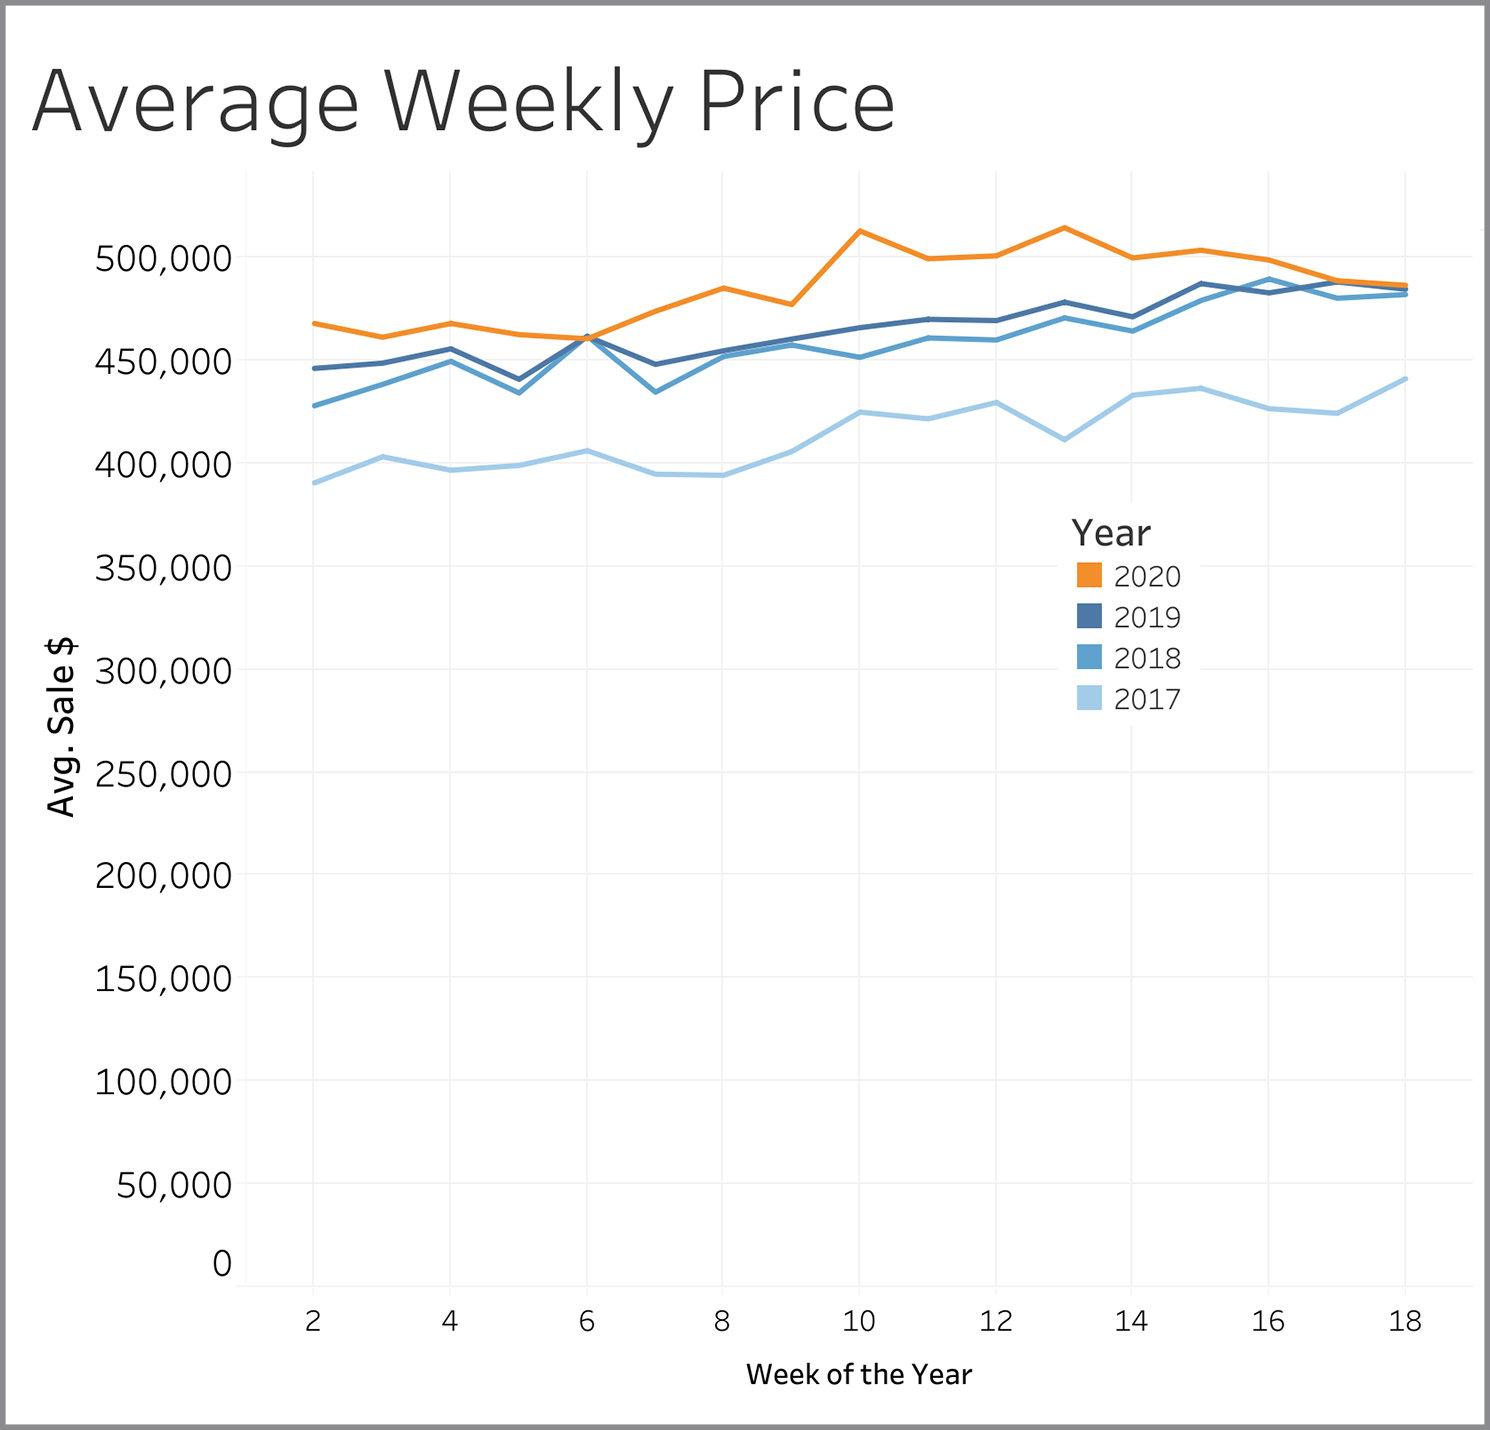
Average Price
The average price of homes closed in a given week is showing a slight downward trend. In the two prior years, average price was flat during Weeks 15 thru 18 but the average price this year has showed a slight downtrend over the same four week period. The average home price in Week 18 this year was essentially identical with the average price last year but that was also true in Week 6. This pattern makes it hard to tell right now if the small decline over the last few weeks is an actual trend or just random variation.
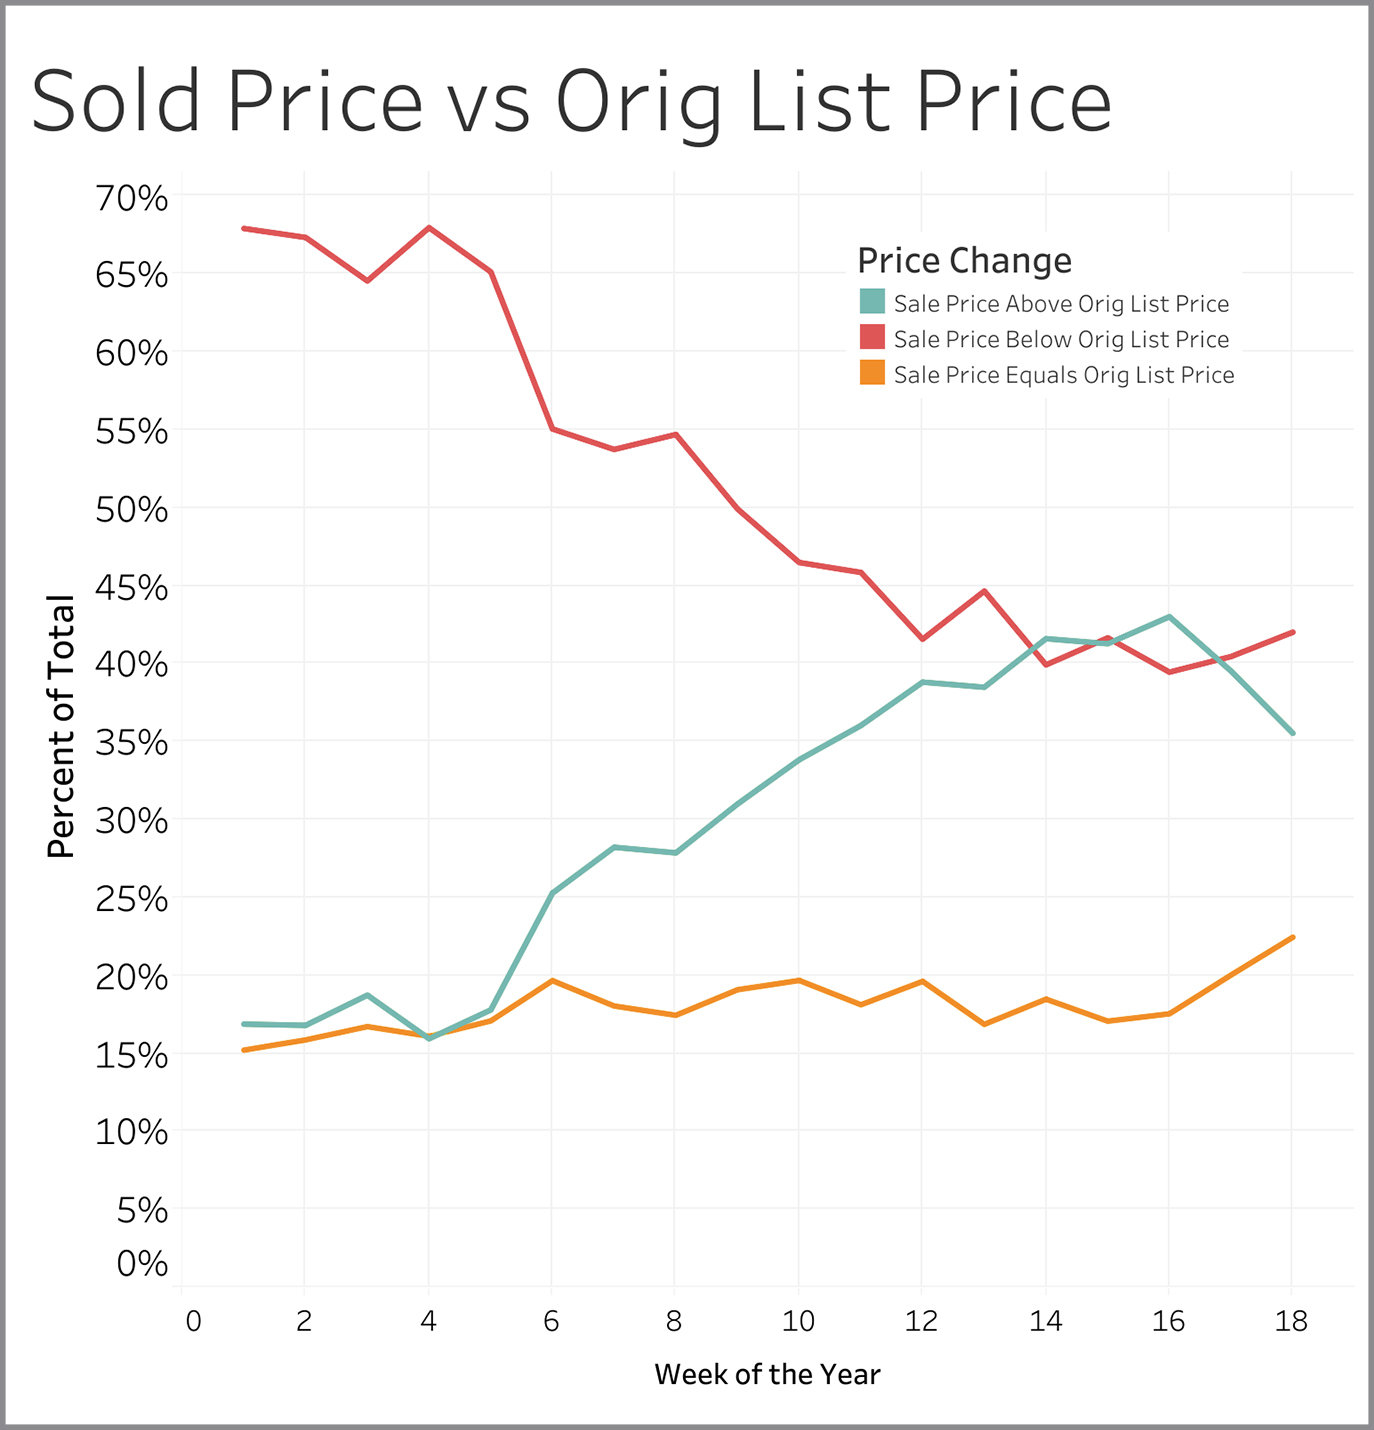
Sold Price vs. Original List Price
The trend from Weeks 4 through 14 had a greater percentage of homes selling above original list price while the percentage of homes selling below original price was decreasing. Both lines have gone flat since then and Week 18 saw 58% of homes with a sale price at or above the original asking price.
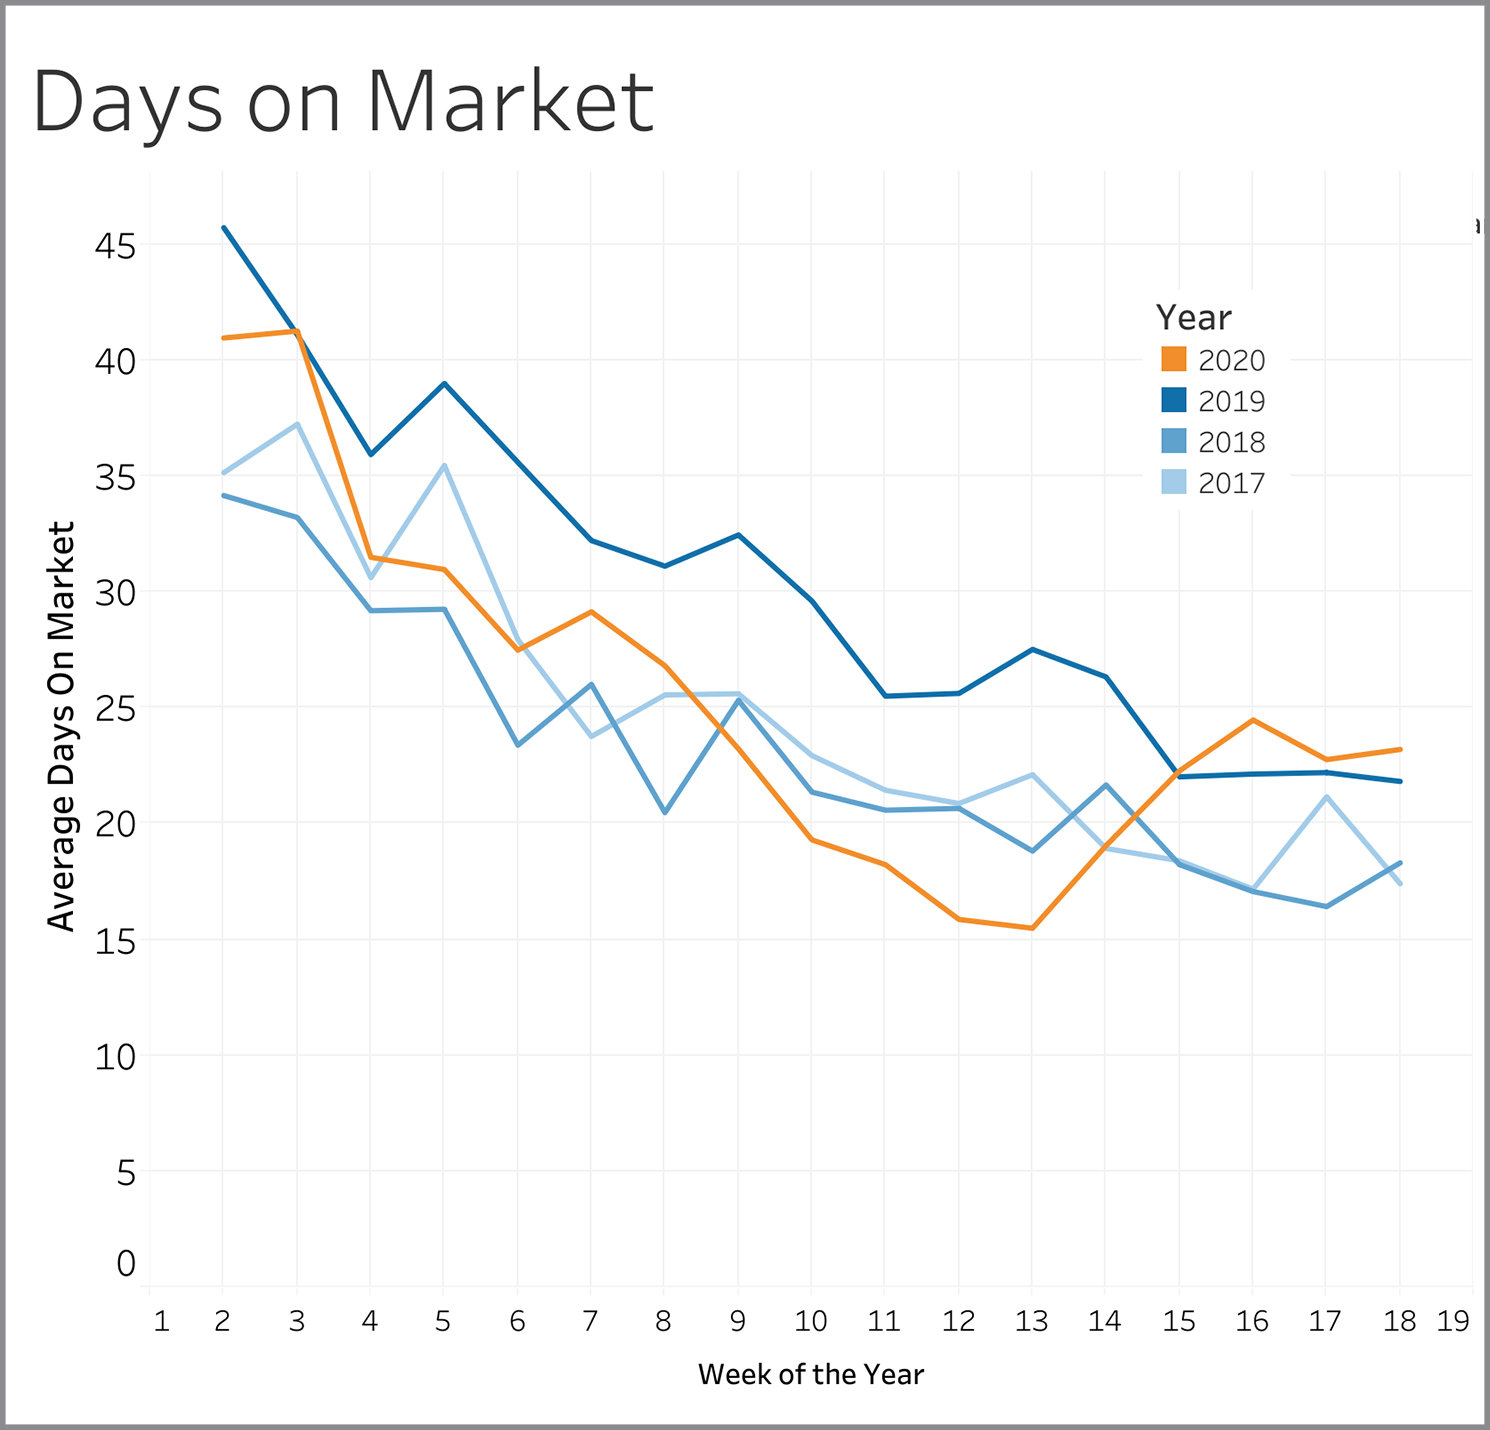
Days on Market
Days on market is the time from when a property first comes on the market to when it goes under contract. The pattern so far in 2020 has been for days on market to be similar to or below the days on market for the three prior years. COVID-19 appears to have little to no impact on how long it takes to get a home under contract.
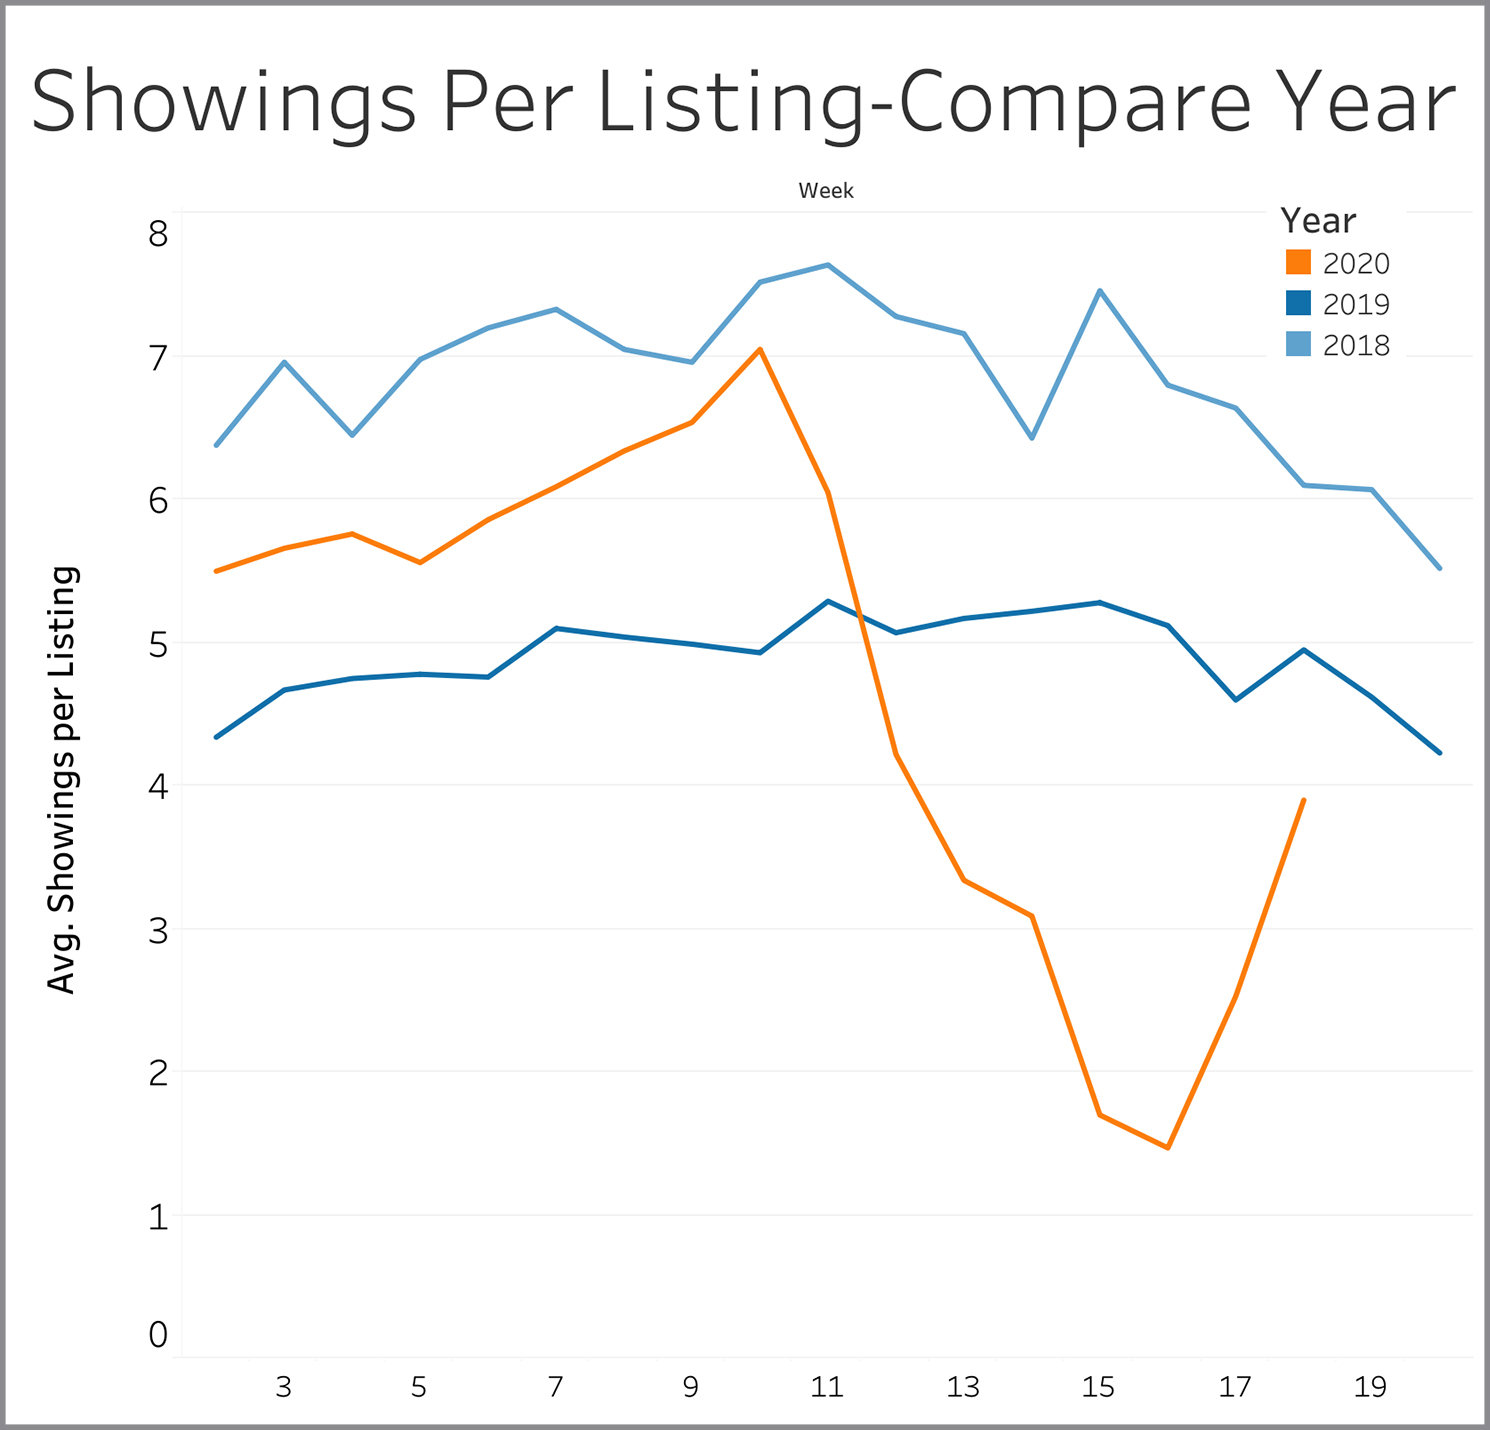
Showings Per Listing
We saw this metric decline consistently after Week 10, but the pattern reversed in Week 17 and this continued into Week 18. Expect this number to continue improving in coming weeks as the last few restrictions on in-person showings disappear from the metro Denver area.