CHR WEEKLY
Findings Through Week 10, 2020
At CHR, we track four leading indicators of market performance and update them weekly: (1) # of new listings, (2) # of homes going under contract, (3) # of homes closed and (4) # of showings. Whenever the market makes a shift, we’ll get the first indications of that here as we peer into the actual behavior of buyers and sellers in near real time.
Through week 10 of this year, the Denver real estate market was on pace to set records.
- Inventory levels were down 21%
- We were on pace to sell a record 57,000 homes
- Home values were up almost another 6%
The graphs linked below show performance through March 10, 2020. We will update these charts each week and provide explanation of any shifts we observe.
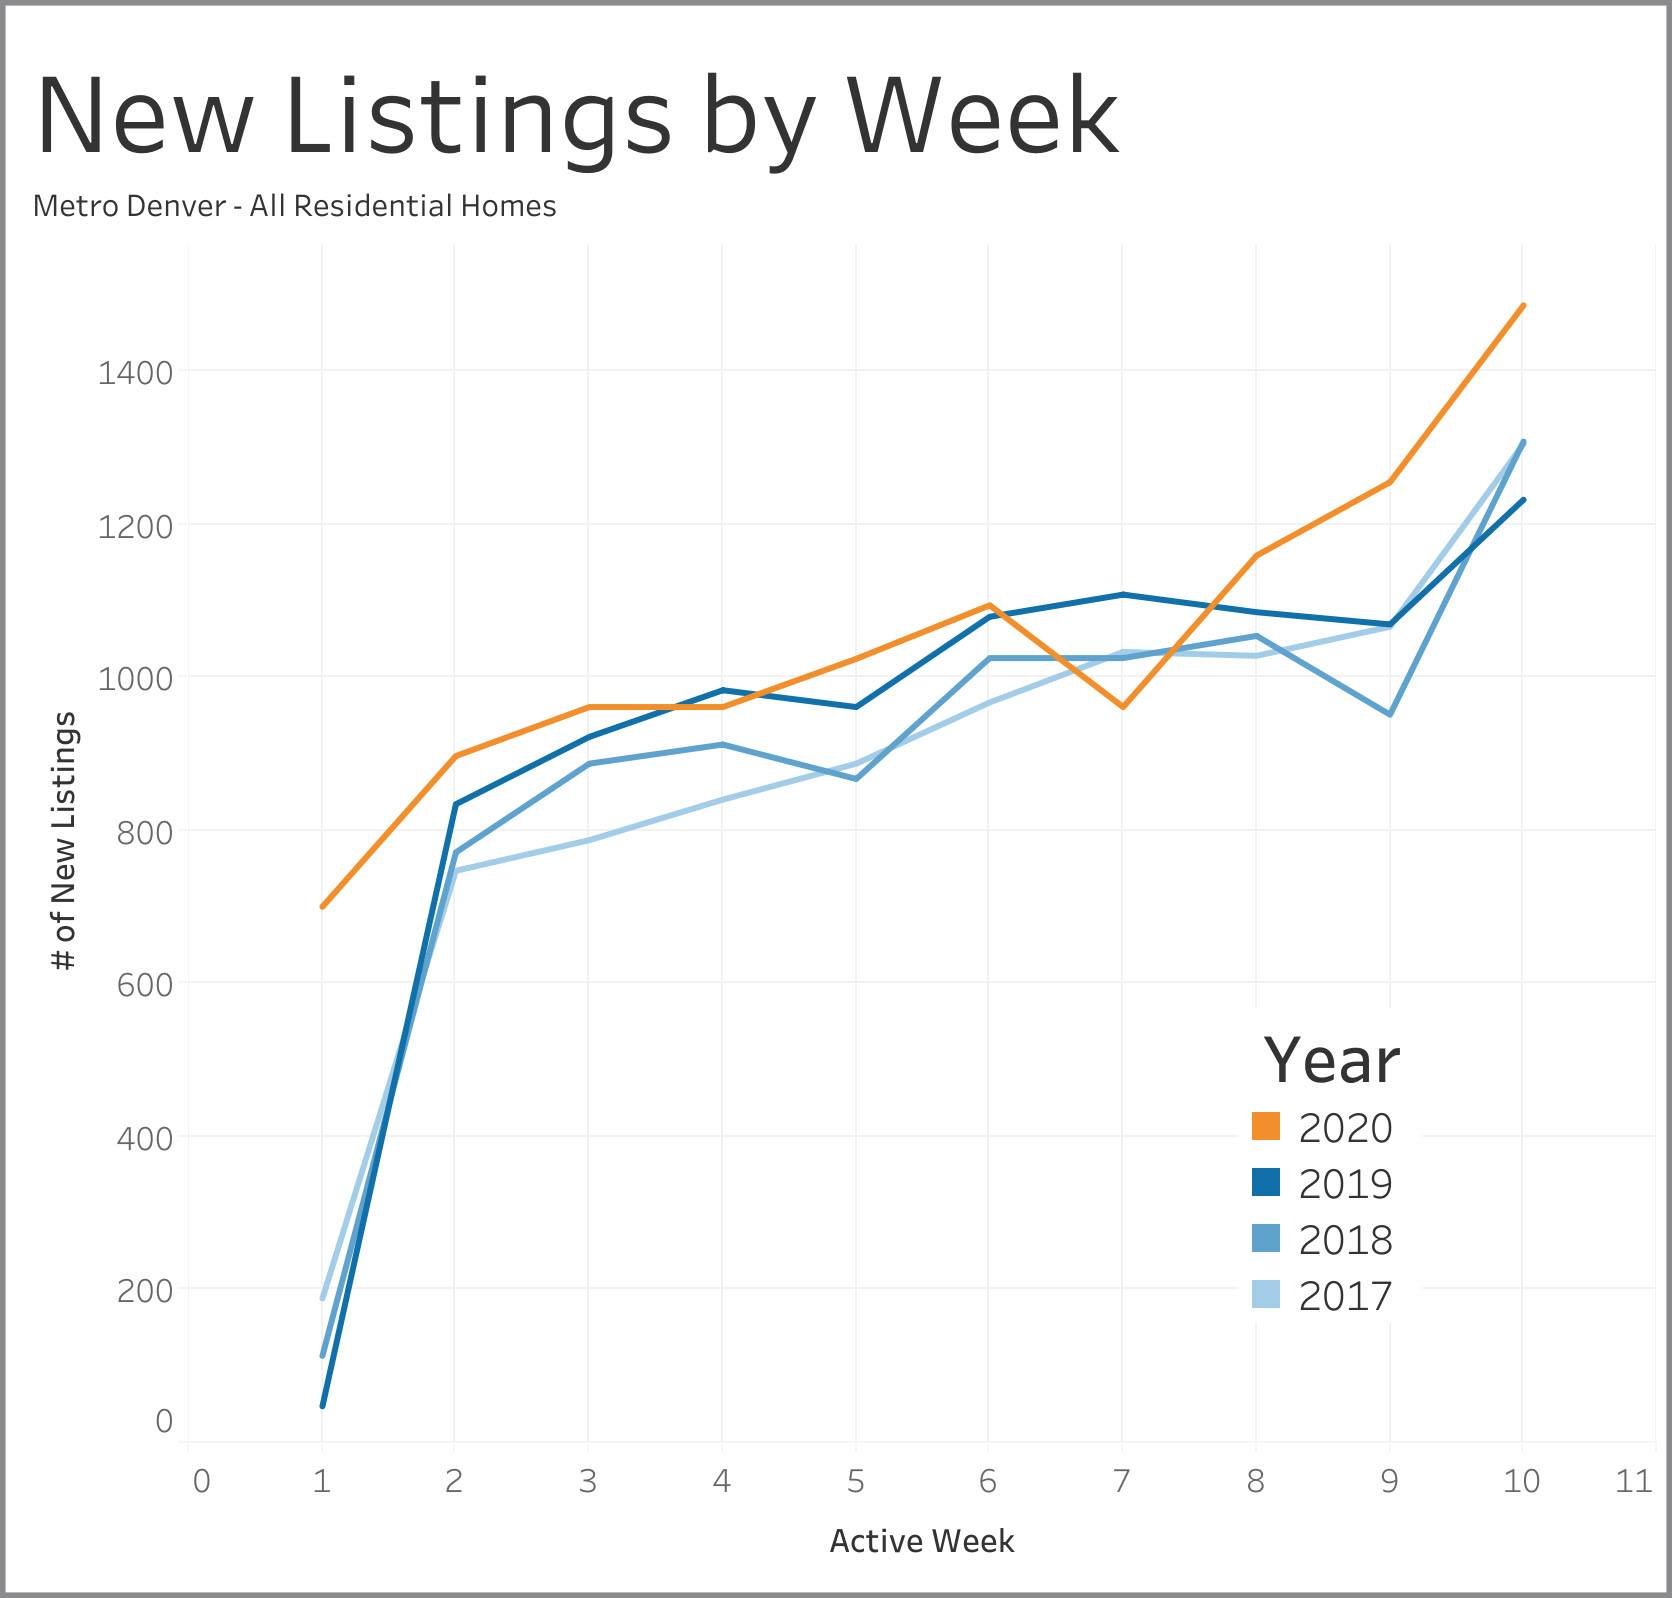
Sellers got started early this year. They pushed almost 500 homes onto the market in the first week of January, which is well above the 30 to 120 homes that popped up in the first week of 2017, 2018 and 2019. New listings have been consistently at or above weekly levels in each of the three prior years, with Week 7 being the only exception.
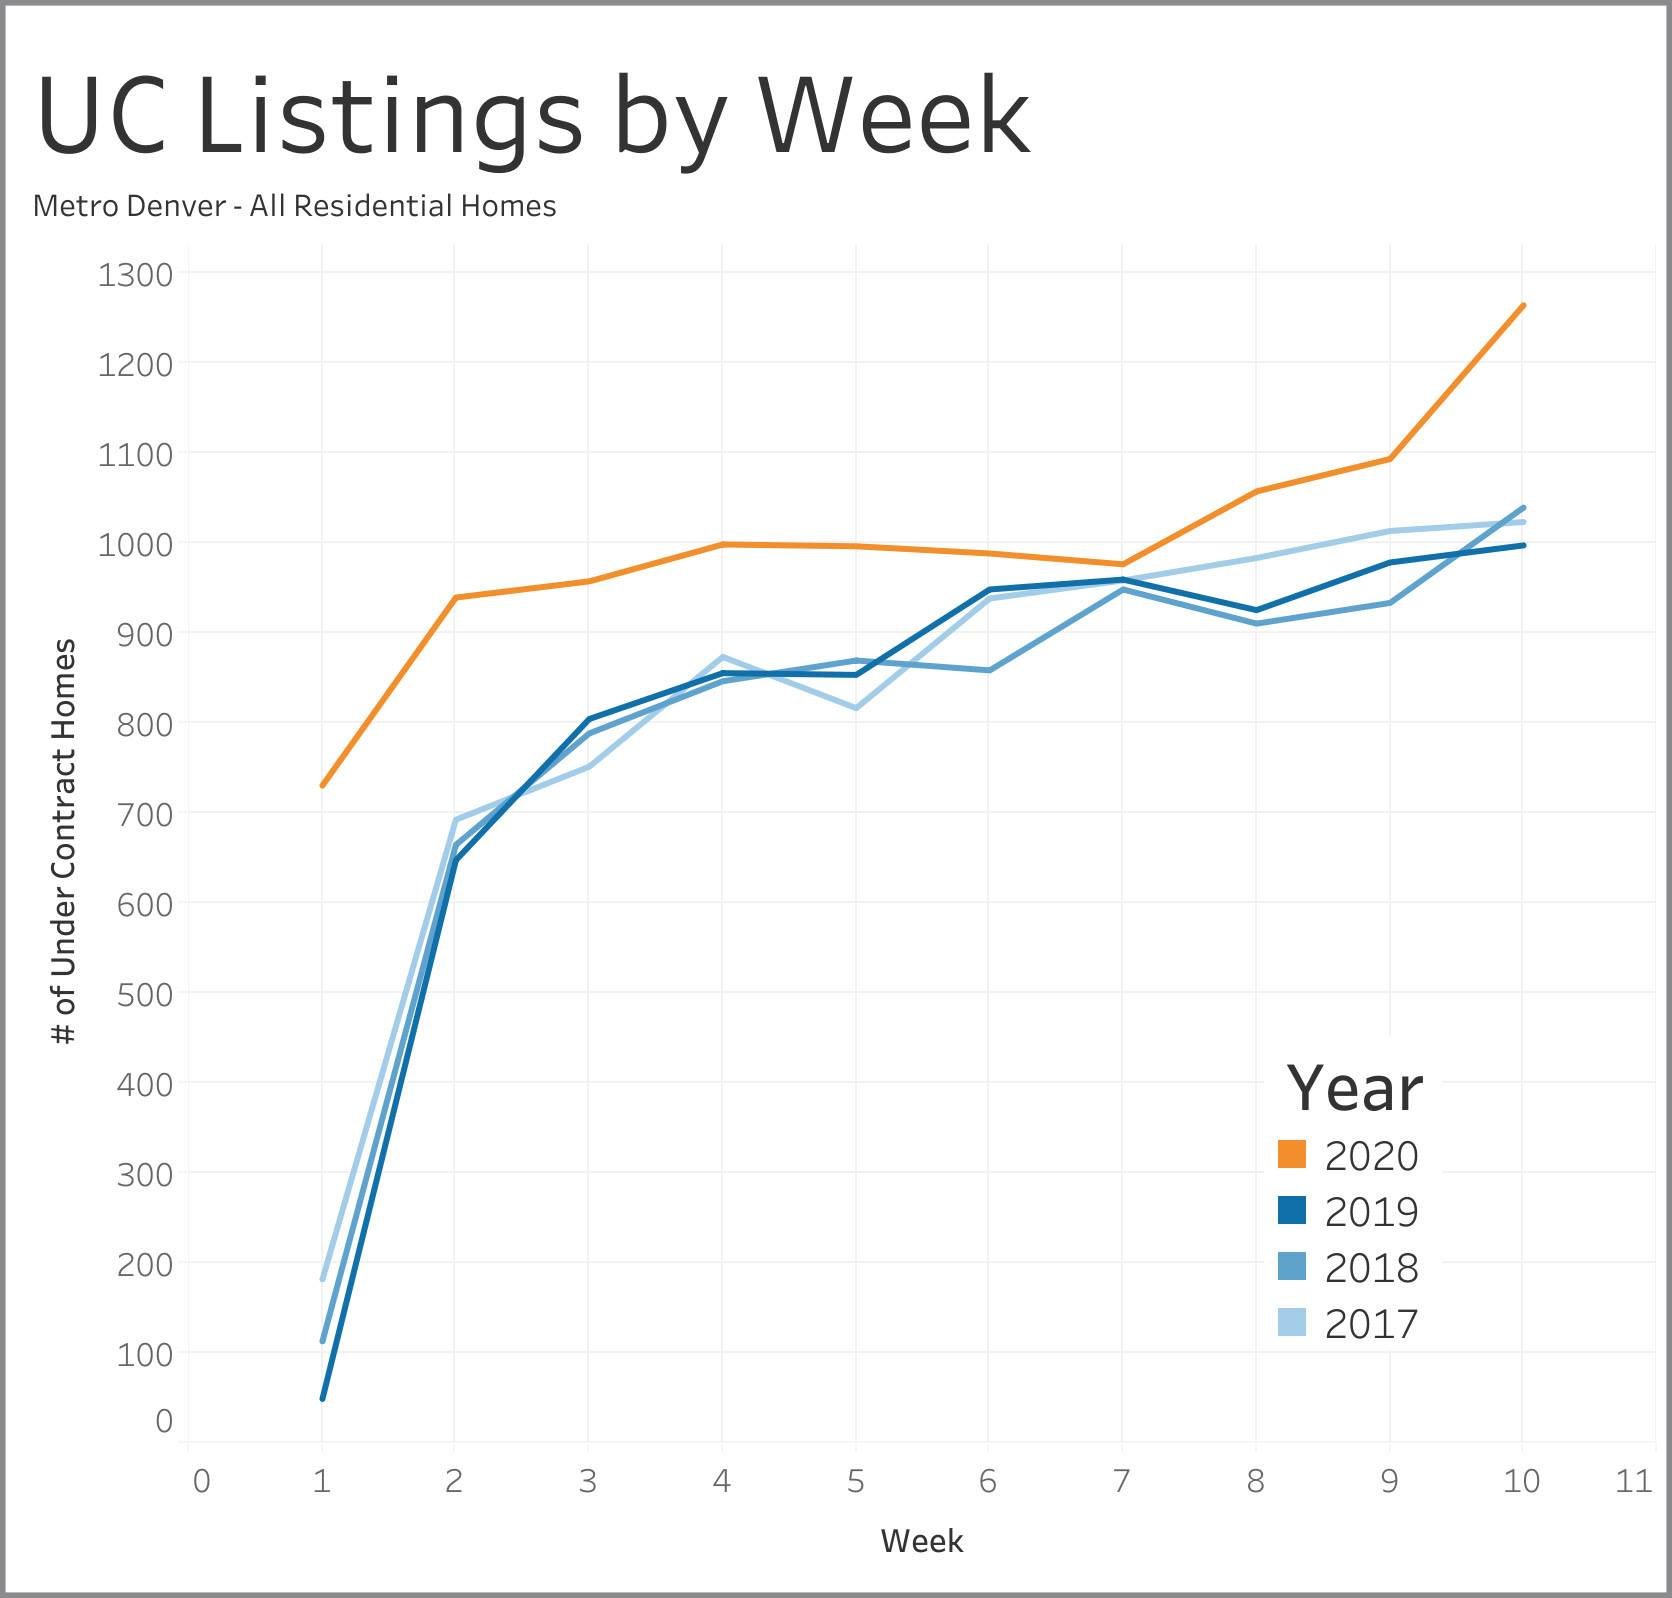
As discussed in the New Listings section, sellers flooded the market with several hundred new listings the very first week of January. Buyers responded immediately and snatched them up, which is why we see the number of properties going under contract in Week 1 greatly exceeding the levels experienced in 2017 - 2019. The number of homes going under contract each week in 2020 has exceed the number for the same week in the prior three years. If sellers will put a house out to the market, buyers are ready, willing and able to gobble them up.
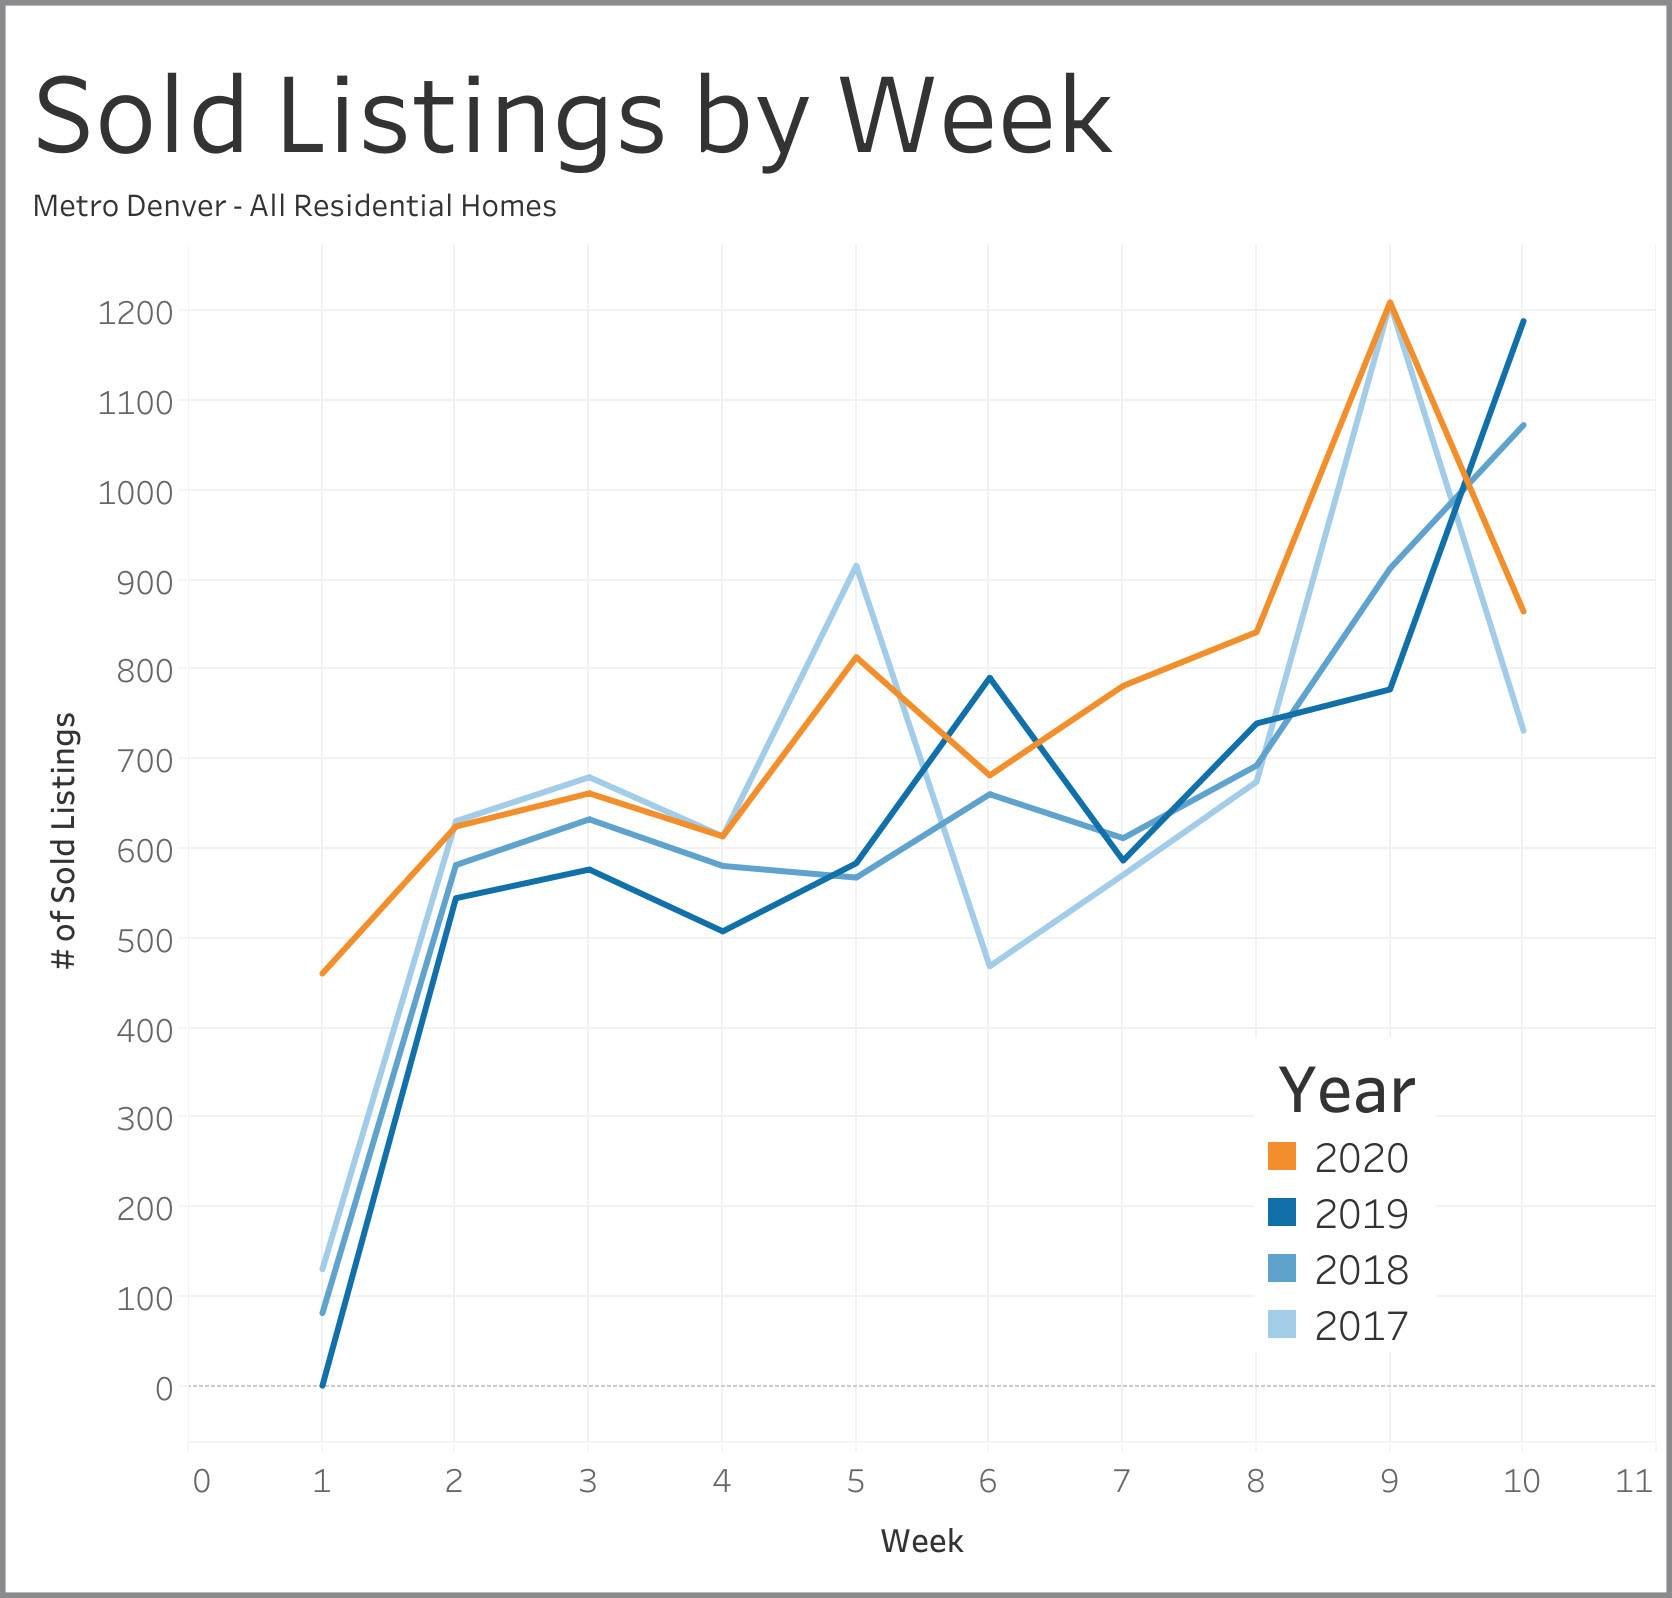
Notice that the number of homes closing each week in in 2020 have exceed the number closed in comparable weeks of 2018 and 2019. Compared with 2017, the number of closings each week this year are sometimes higher and sometimes lower. However, the cumulative effect so far in 2020 is about 600 more closed deals than we experienced in the first 10 weeks of 2017.
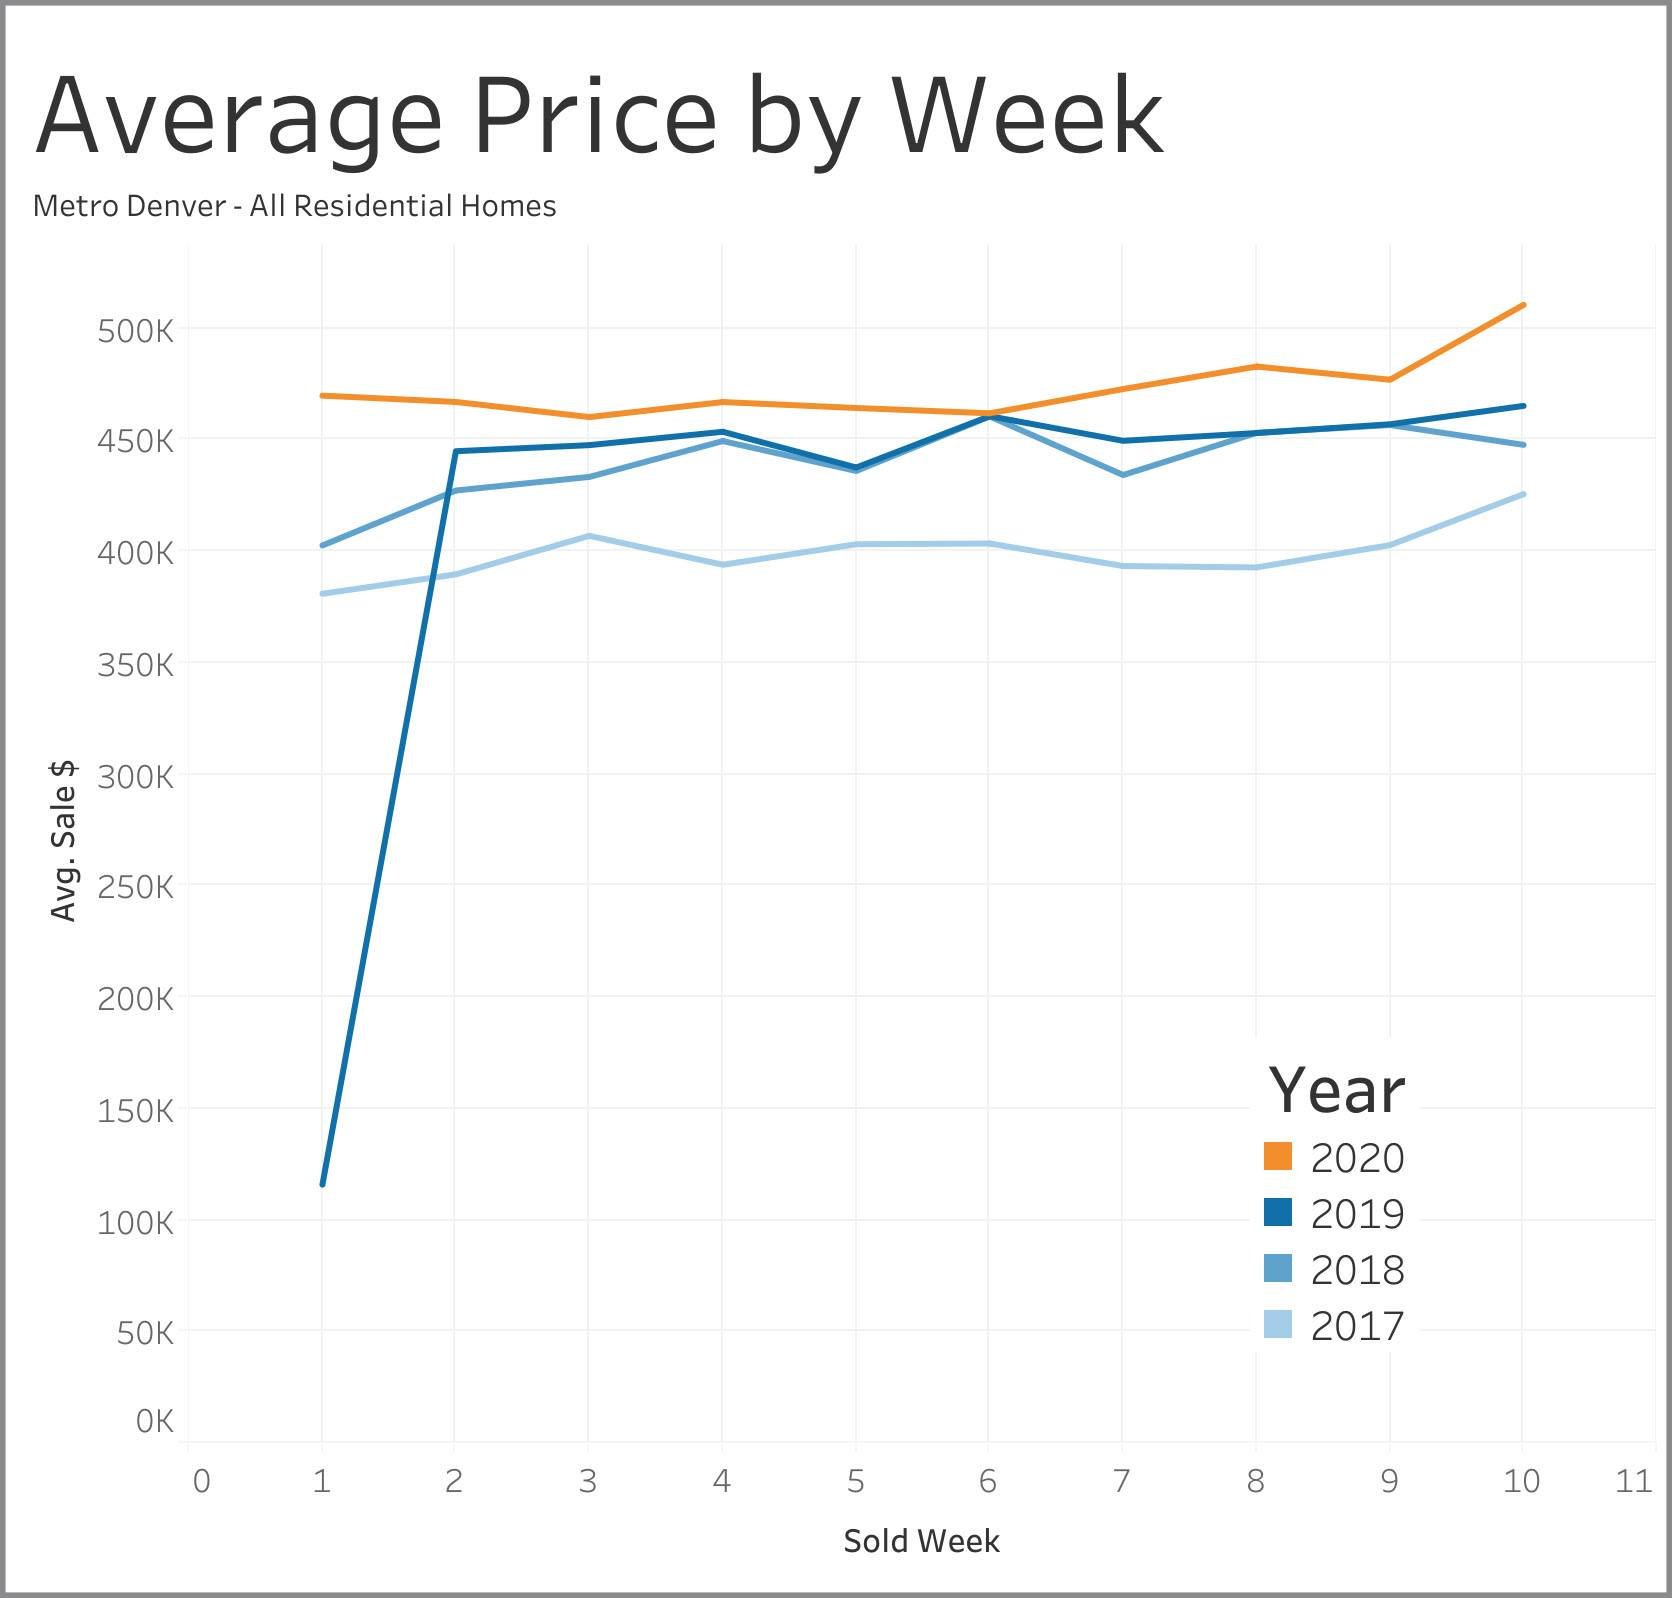
Average prices are up 3% to 6% compared to 2019 except for Week 6 showing no change from the prior year and for Week 10 with an almost 10% increase. This is pretty much what we expect given that the metro Denver market has been strongly appreciating over the time period analyzed.
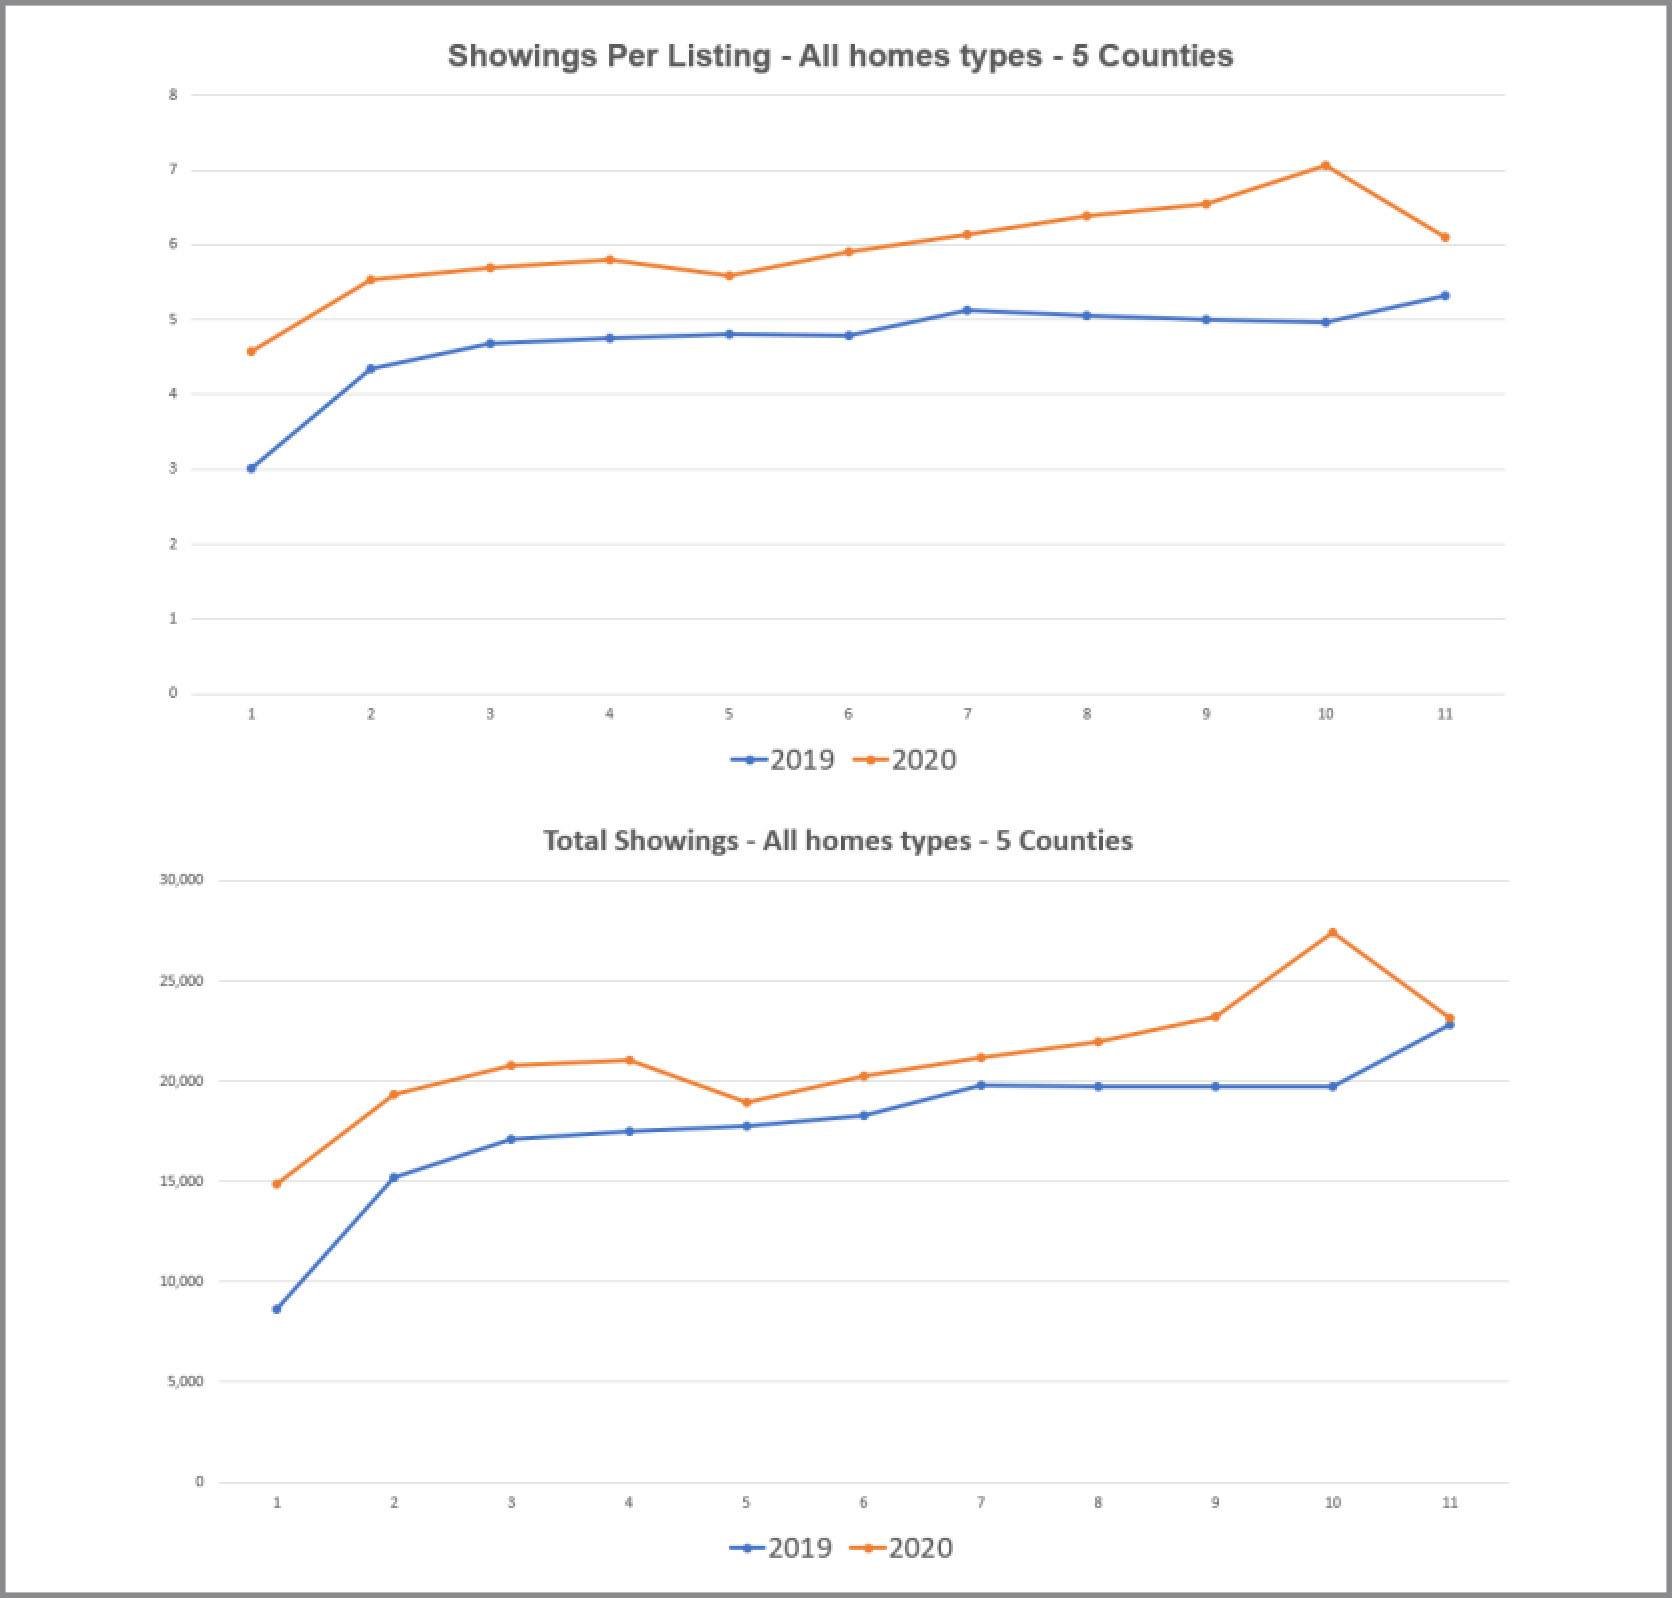
Showings