CHR MARKET UPDATE
Findings Through Week 29, 2020
The metro Denver real estate market continues to move at a torrid pace. The average weekly price has climbed 15% in the last five weeks. Almost 6900 homes went under contract in June and that is 19% higher than June of last year … fueled in part by interest rates dipping under 3%. While homes continue to come on the market at levels comparable to last year, the big increase in contracts is causing inventory to be extremely low but not yet at historically unprecedented numbers. We saw similarly low inventory in June 2015.
Week 29 began on July 8th and ended on July 14th.
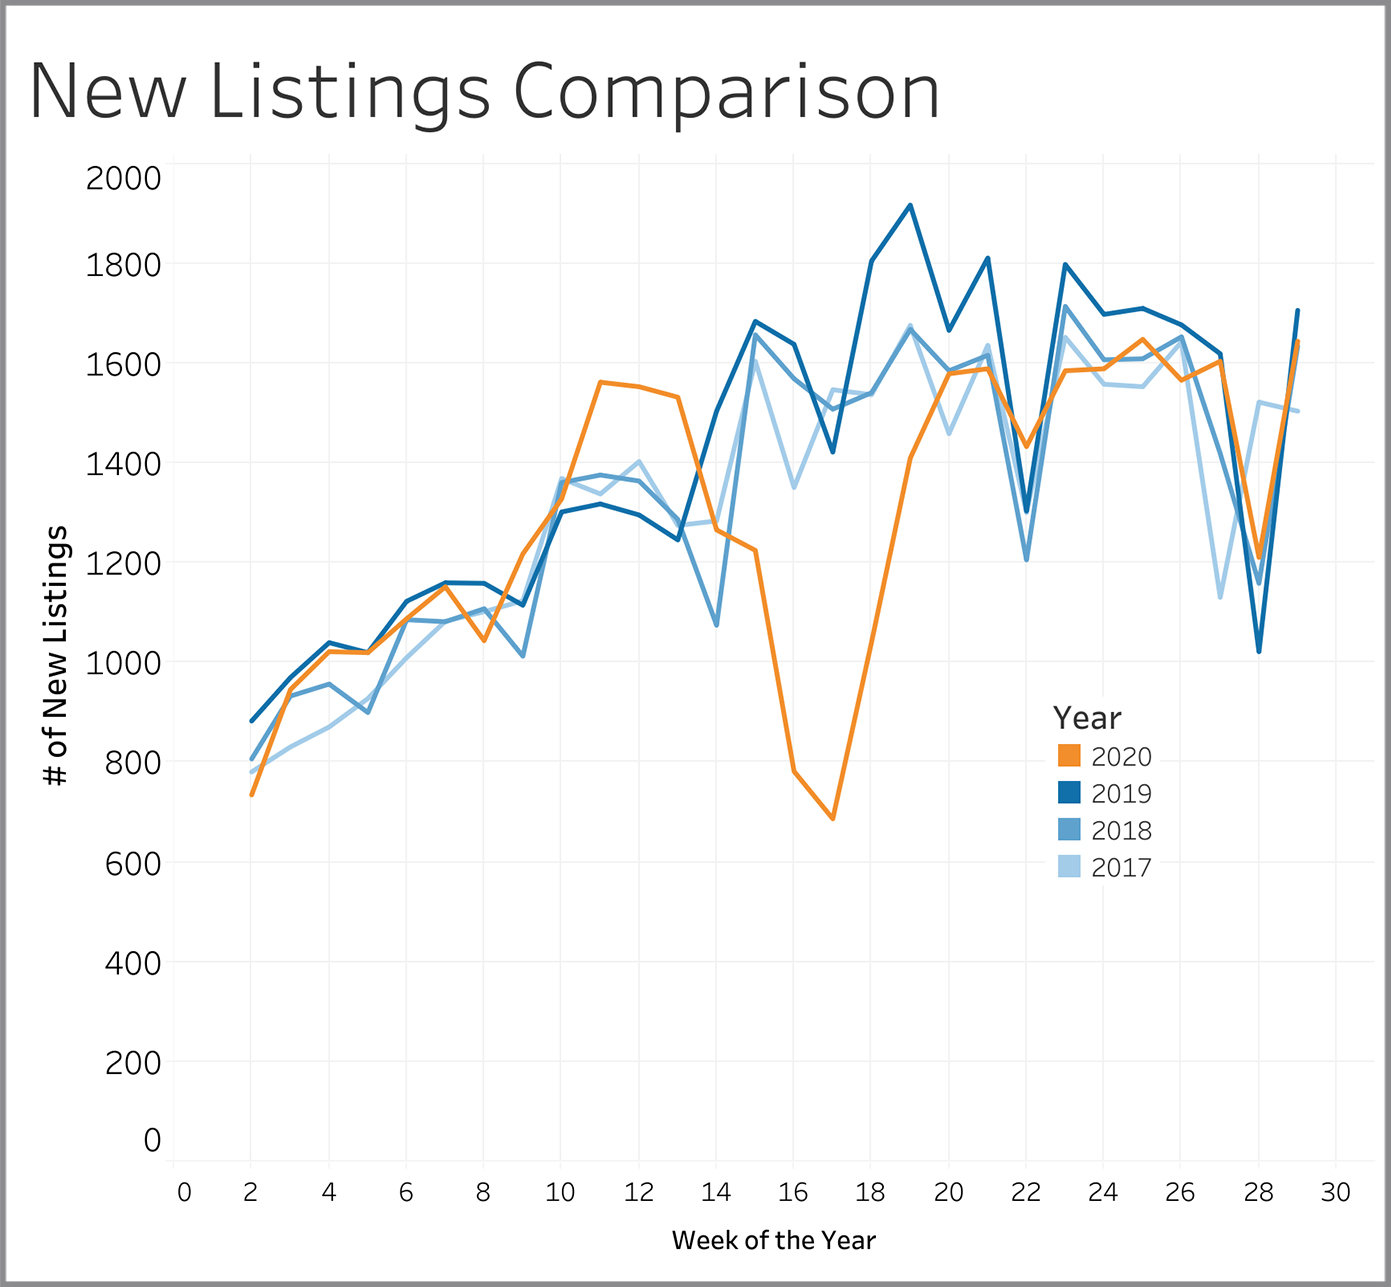
New Listings
New listings reflect seller attitudes on whether this is a good time to be selling. For the last 10 weeks, the number of new listings hitting the market has been at a similar level and is following a similar pattern as seen in the three prior years.
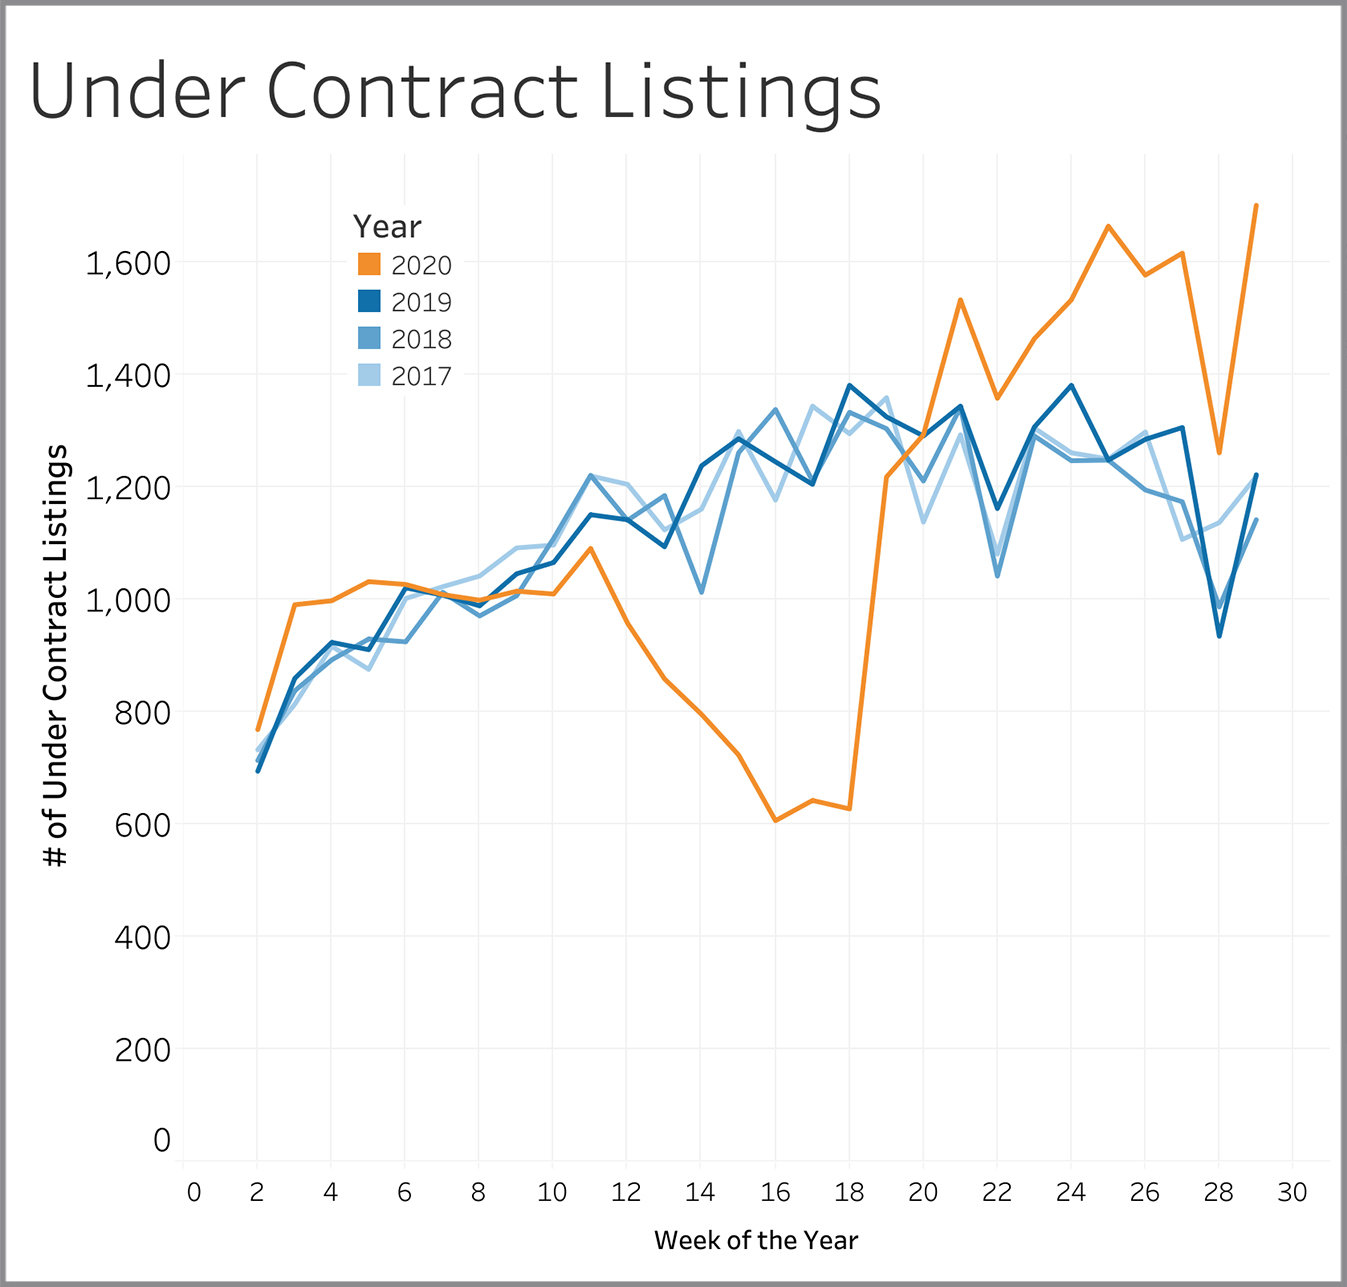
Under Contract Listings
Properties going under contract show us whether buyers are confident to do business in the current market environment. The number continues to soar with 1,700 homes finding a buyer in Week 29 compared to the 1,100 to 1,200 that was typical for this time of year in the last three years.
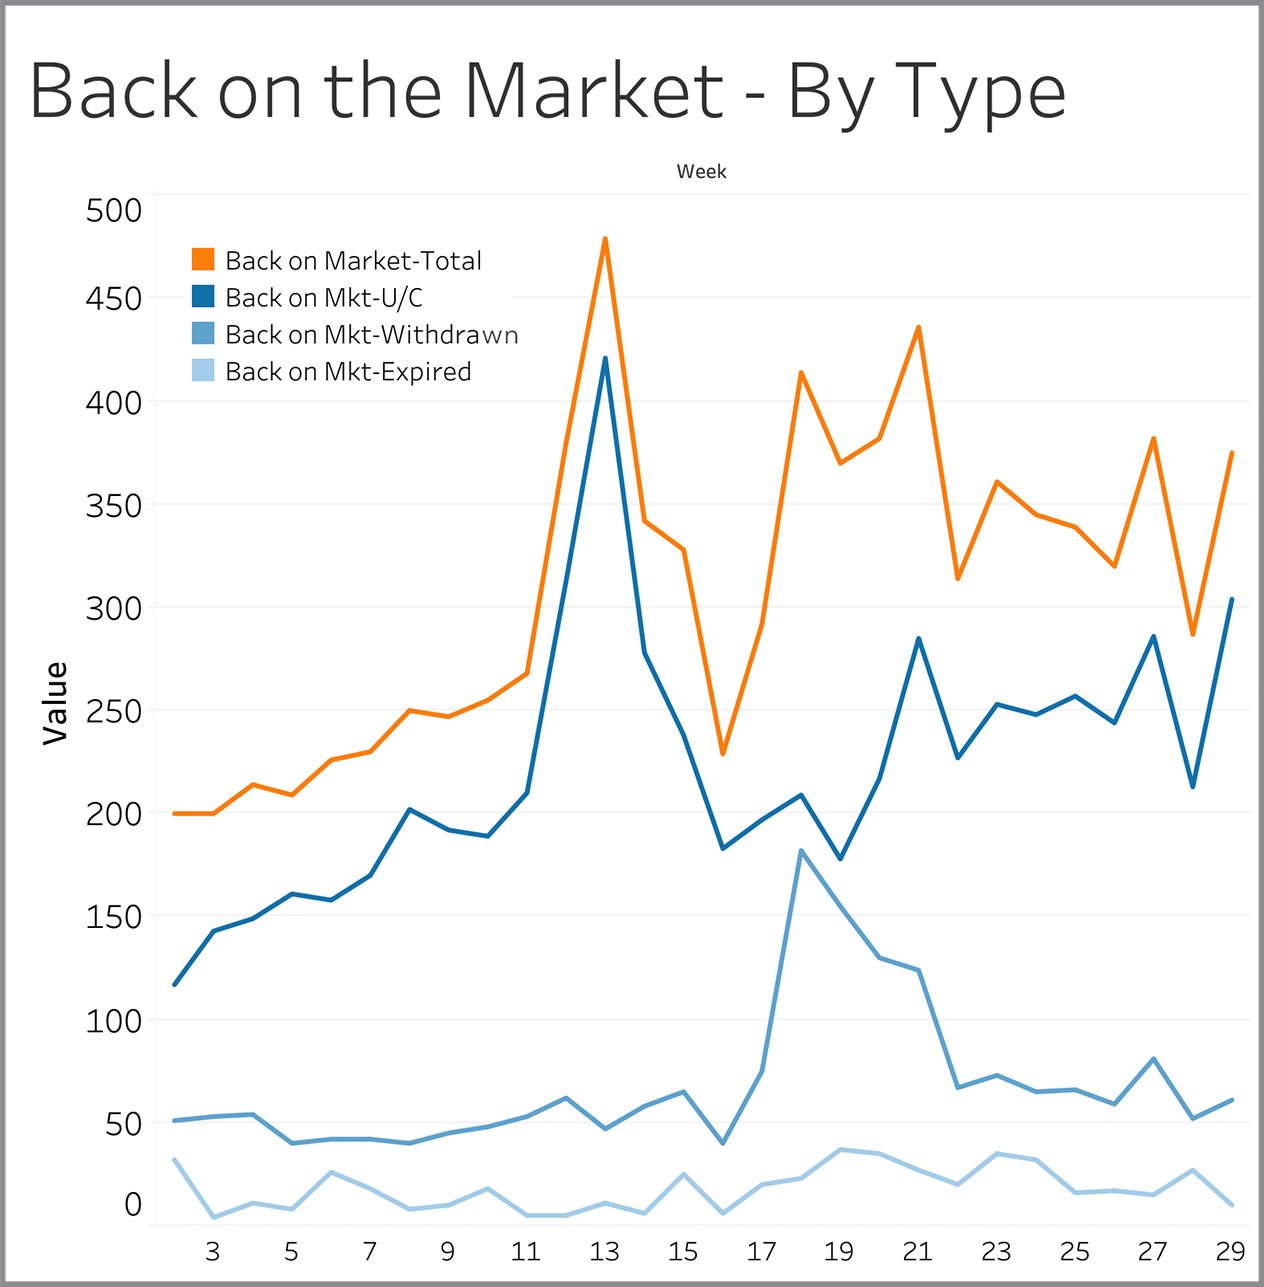
Back on Market – By Type
Listings come back on the market for three reasons: (1) Seller lost a deal with one buyer and is now looking for another one; (2) Seller took a break from showing the property and is now allowing showings again; (3) Seller let his/her listing expire and then came back to the market within 30 days with either the same agent or a different agent. Losing a buyer accounted for over 80% of the properties coming back to the market in Week 29. The overall number of homes coming back on the market was 375 in Week 26, which is about 15% higher than what was experienced in 2017 through 2019 (data not shown on this chart).
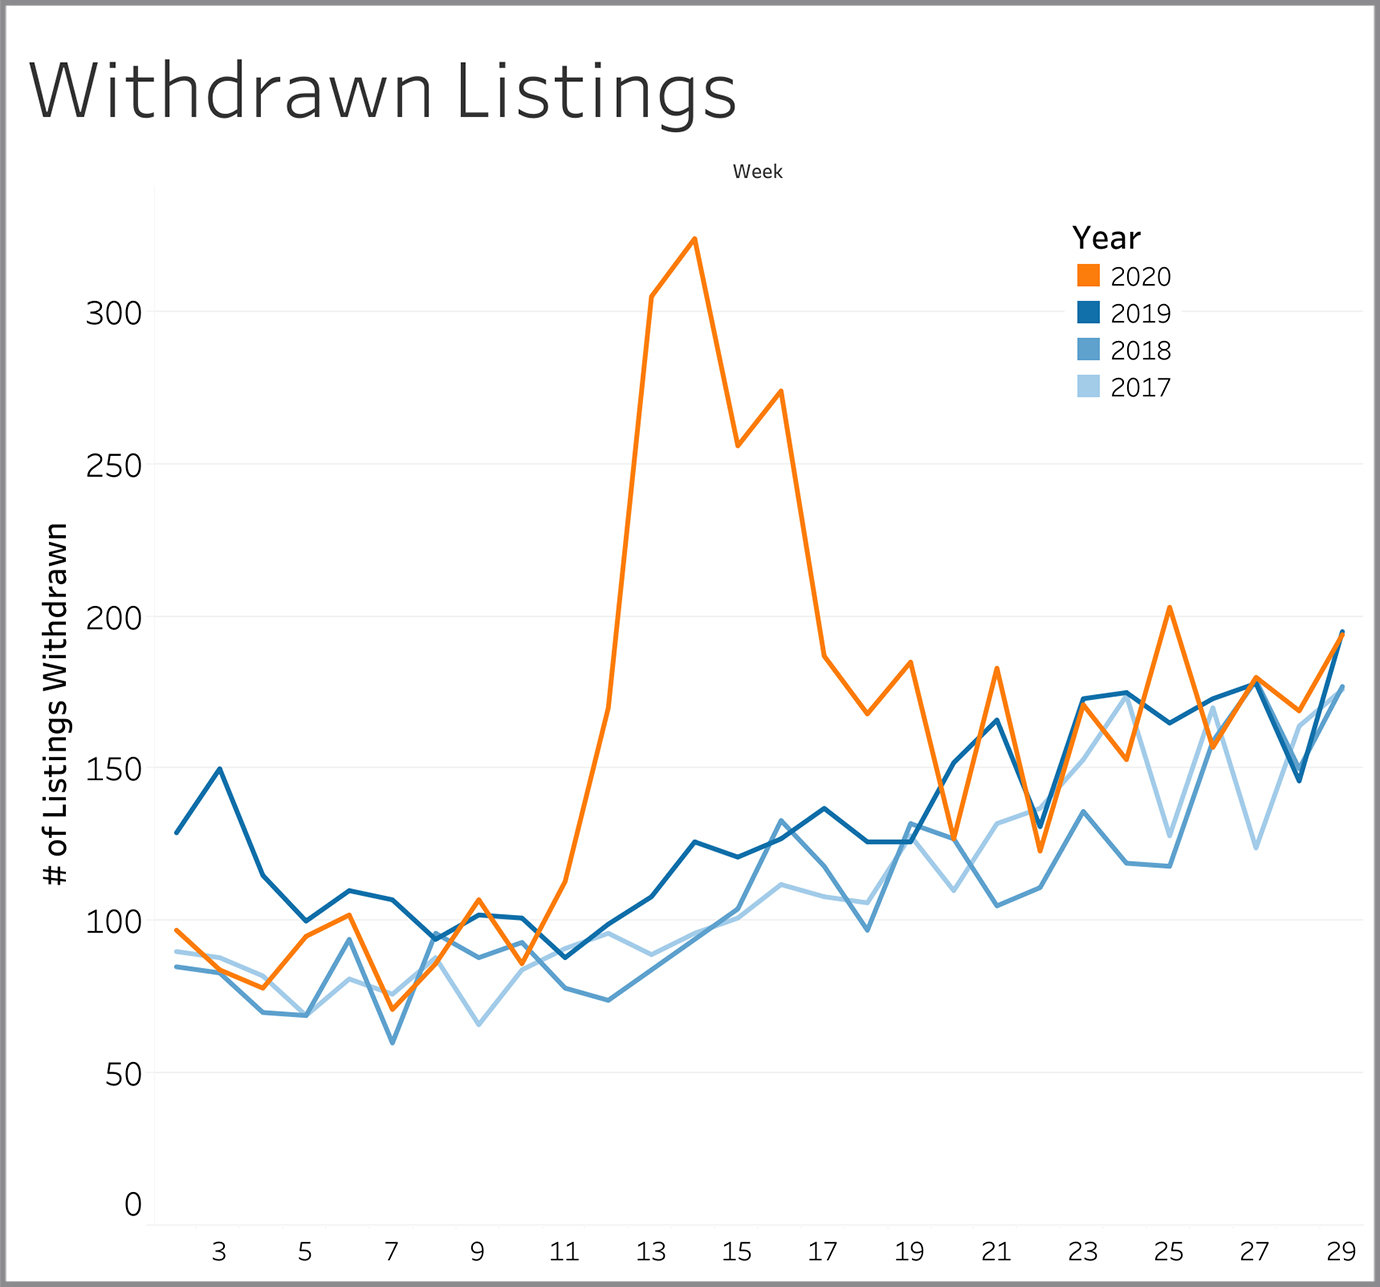
Withdrawn Listings
Withdrawn listings are sellers that have either given up altogether on selling or that have temporarily halted showings. The 194 withdrawn listings we saw in Week 29 is unchanged from where it stood last year at this time.
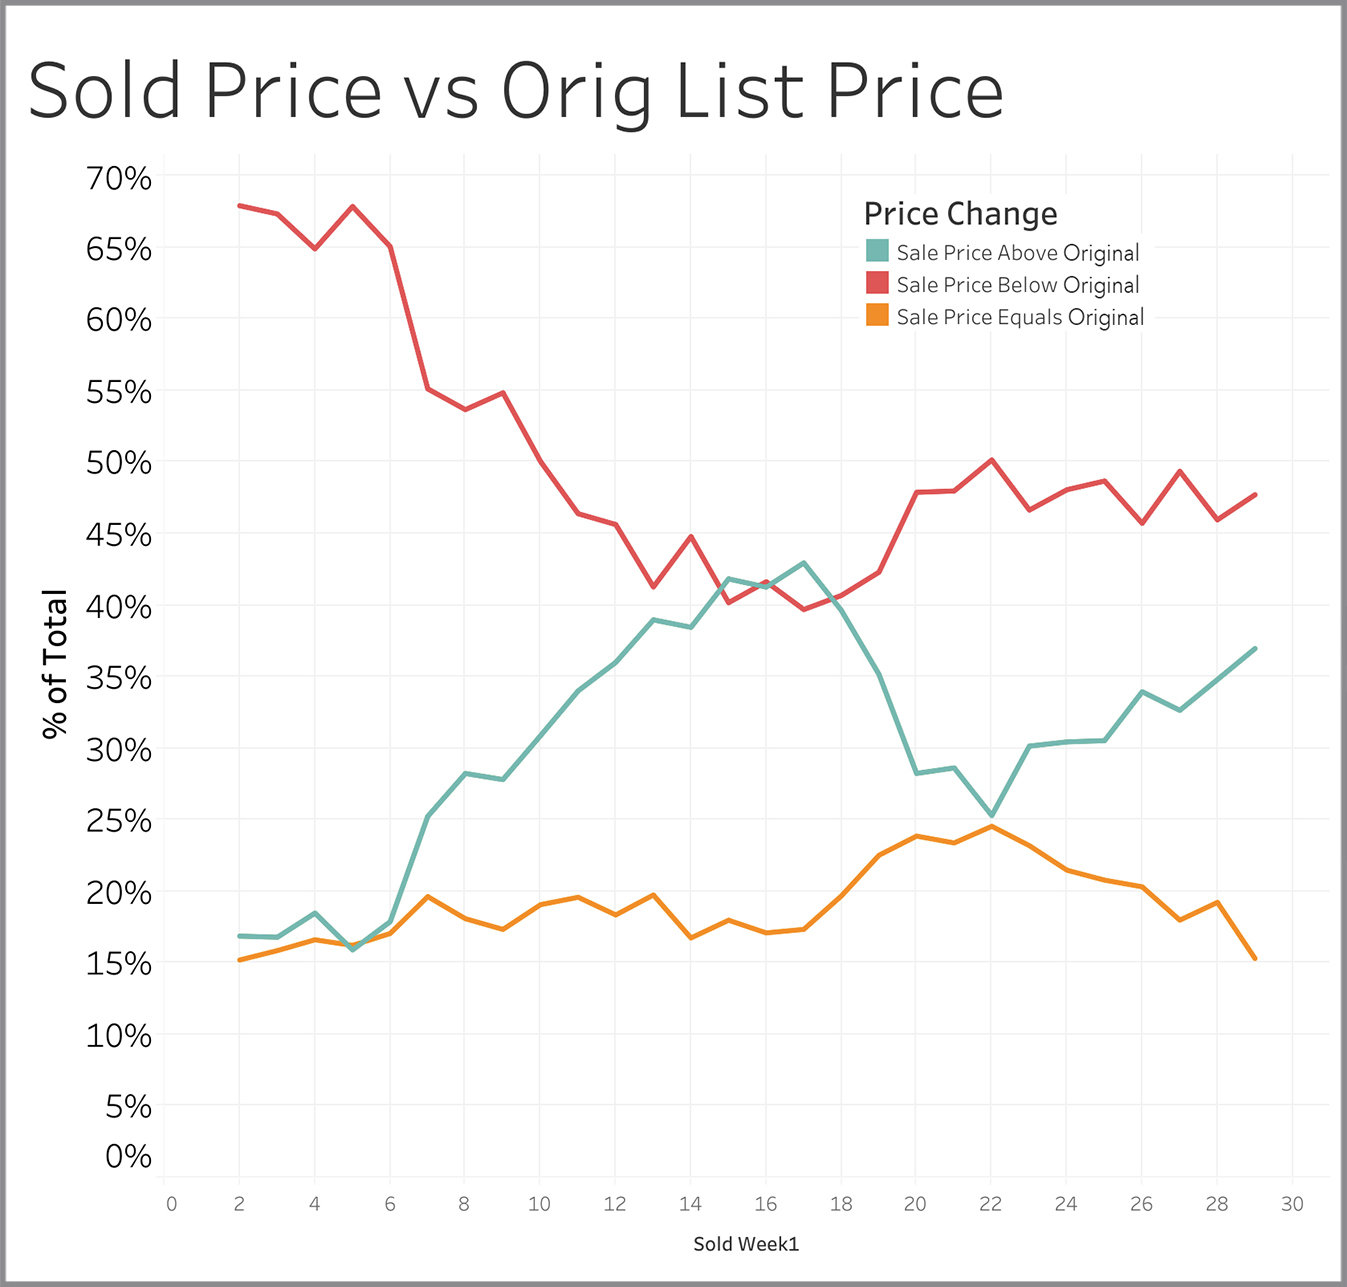
Sold Price vs. Original List Price
The pattern has been very consistent for the last ten weeks. Between 50% to 55% of sellers get at or above asking price while the other 45% to 50% end up a price that is below their original asking price.
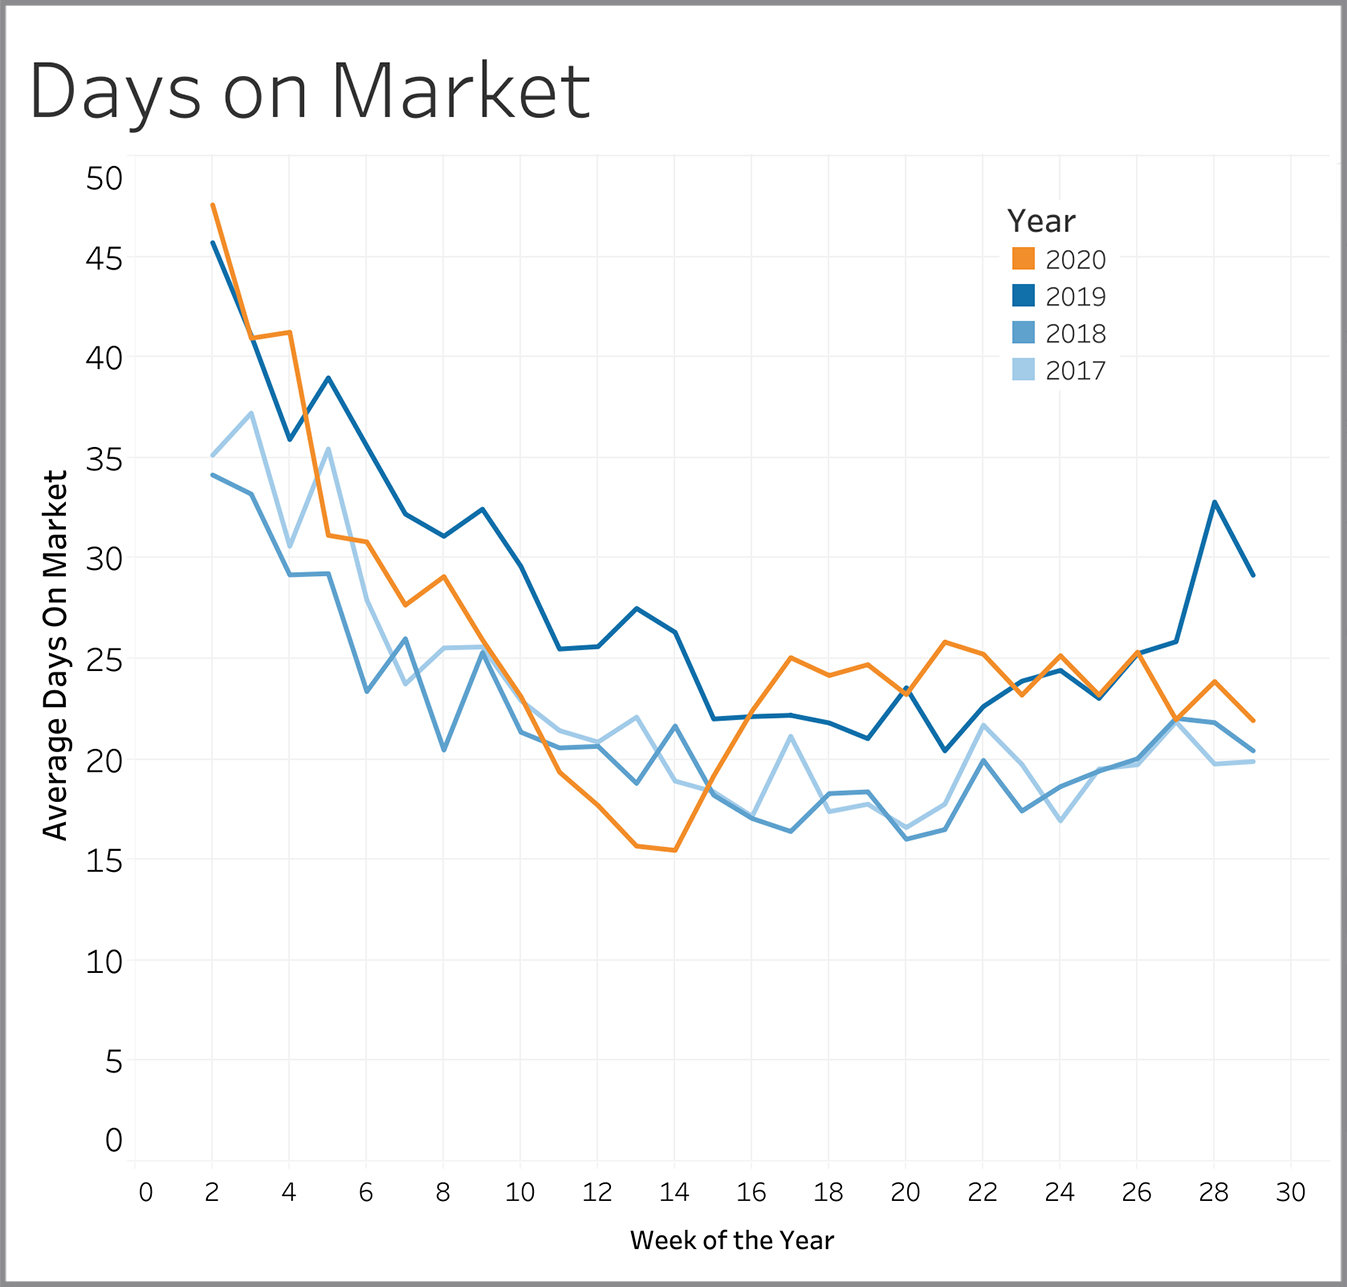
Days on Market
Days on market is measured from the time a property first comes on the market to when it goes under contract. At 22 days for Week 29, we are seeing numbers towards the low end of normal compared to the last three years.
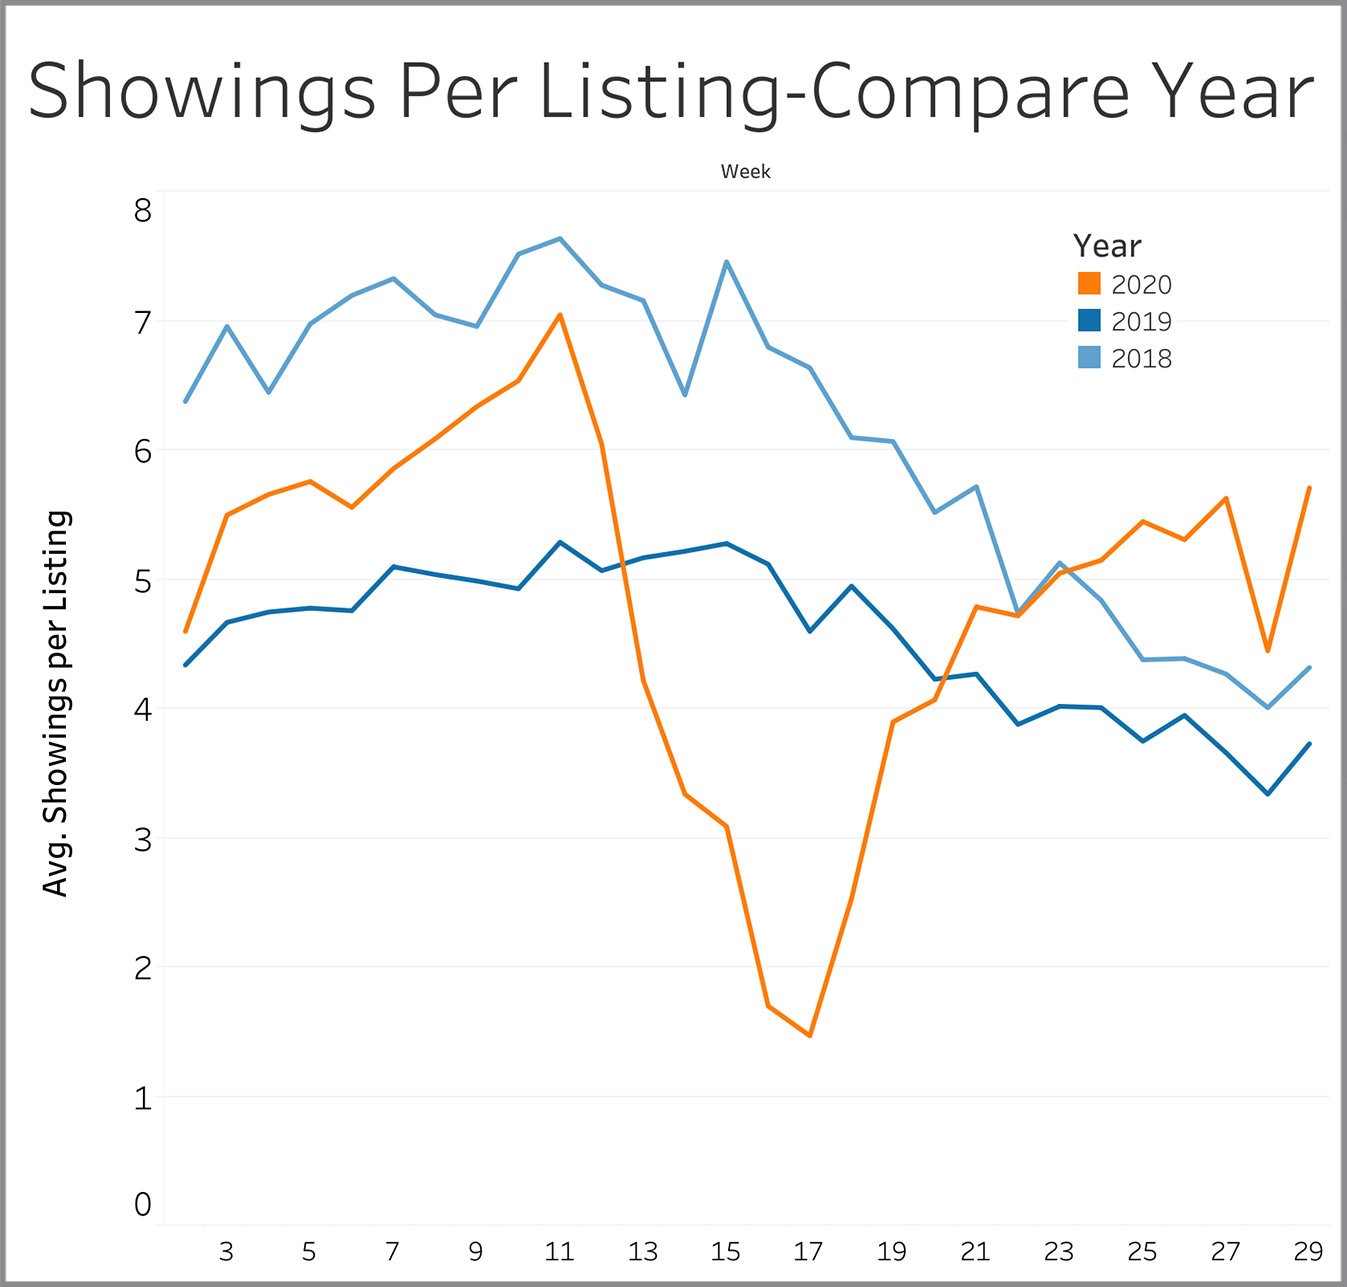
Showings Per Listing - Compare Year
We saw this metric decline consistently after Week 10, but the pattern reversed in Week 17 and is now somewhat higher than levels seen in 2018 and 2019. While COVID would be expected to suppress showing activity, we see properties getting 1.5 to 2 more showings per week than in the two prior years.
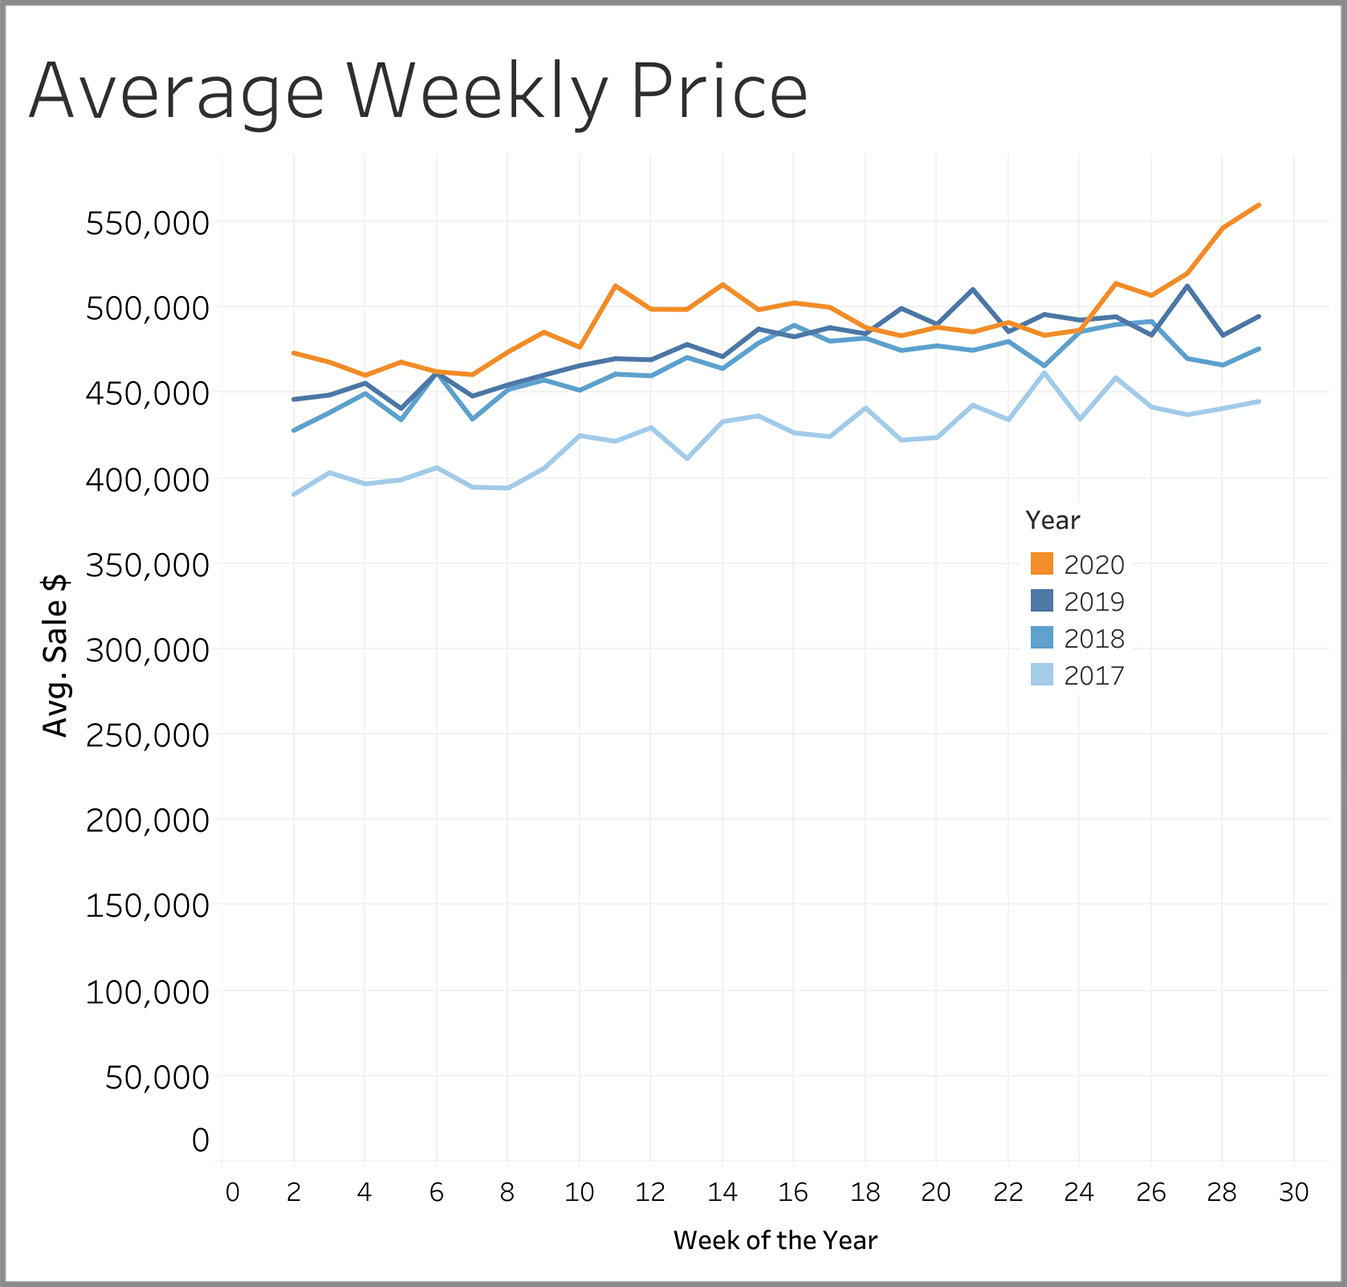
Average Weekly Price
The average price of properties closed in a given week reflects market conditions that existed about a month ago since it typically takes a month for a property to close once it goes under contract. Prices went flat and even declined a bit starting in Week 15, which is about a month after the first Stay at Home order was issued. They continued declining through Week 24, a pattern that is definitely counter to the generally rising price pattern over the same time frame in the three prior years. Prices have soared since Week 25 and now stand 13% higher than a year ago at this time.
Months Of Inventory - Long Term
Months of inventory is computed by taking the rate at which homes are selling and dividing it into the number of homes available. It measures how long it would take to sell all the homes currently on the market if homes keep selling at the current rate. Anything less than 3 months is considered a seller’s market. The 0.86 months of inventory for detached single-family homes in June this year is the 2nd lowest value we’ve seen over the last 3½ year, eclipsed only by the 0.838 months of inventory in December 2017. The 1.363 months of inventory for attached single family homes (condos, townhouses, duplexes, etc.) is the 4th lowest value we’ve had in the last 42 months.
.jpg)
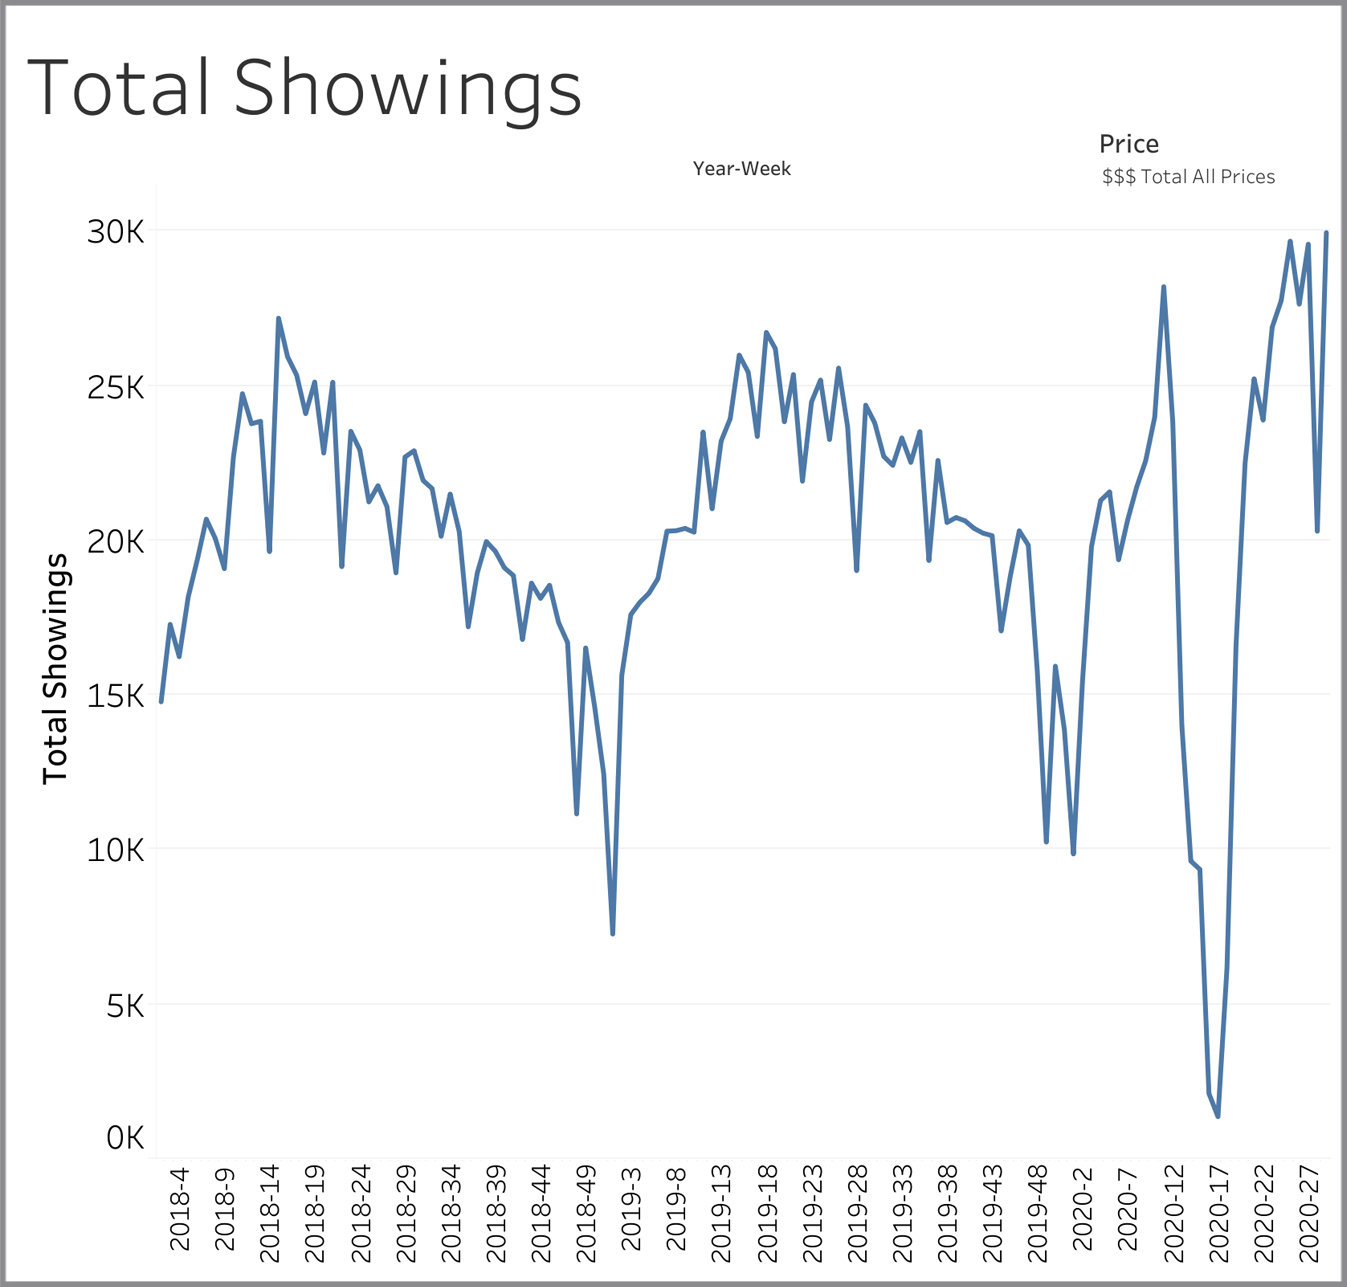
Total Showings
Total showings lagged in Week 28 as expected since it included the 4th of July weekend. In Week 29, we are back to almost 30,000 showings and this greatly exceeds levels seen last year even though there were 34% more homes on the market last year at this time.
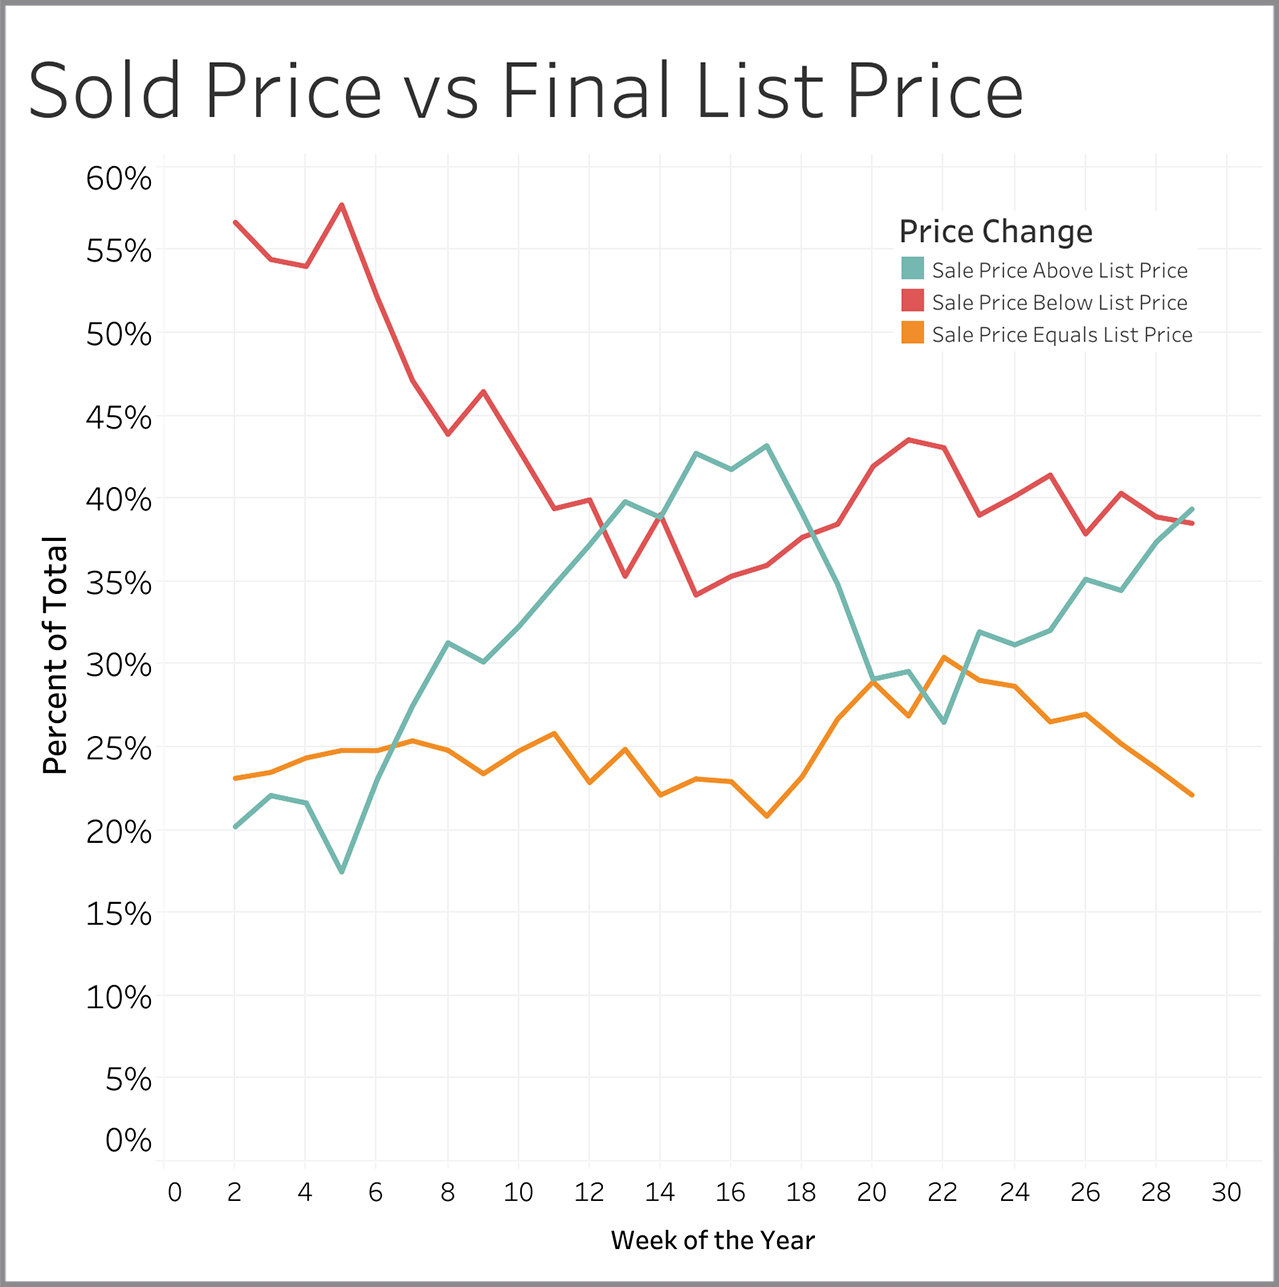
Sold Price versus Final List Price
Over the last few weeks, we’ve seen the number of sellers getting at or above their final asking price trend upwards from 55% to 60%.