CHR MARKET UPDATE
Findings Through Week 26, 2020
Week 26 began on June 24th and ended on June 30th.
The Denver Metro real estate market shows no signs of slowdown after a gigantic bounce back from the March/April shelter-in-place public health orders. Home prices are appreciating briskly. Inventory levels remain a concern however, as single-family homes are at their lowest levels, likely ever seen in the Denver market this time of year.
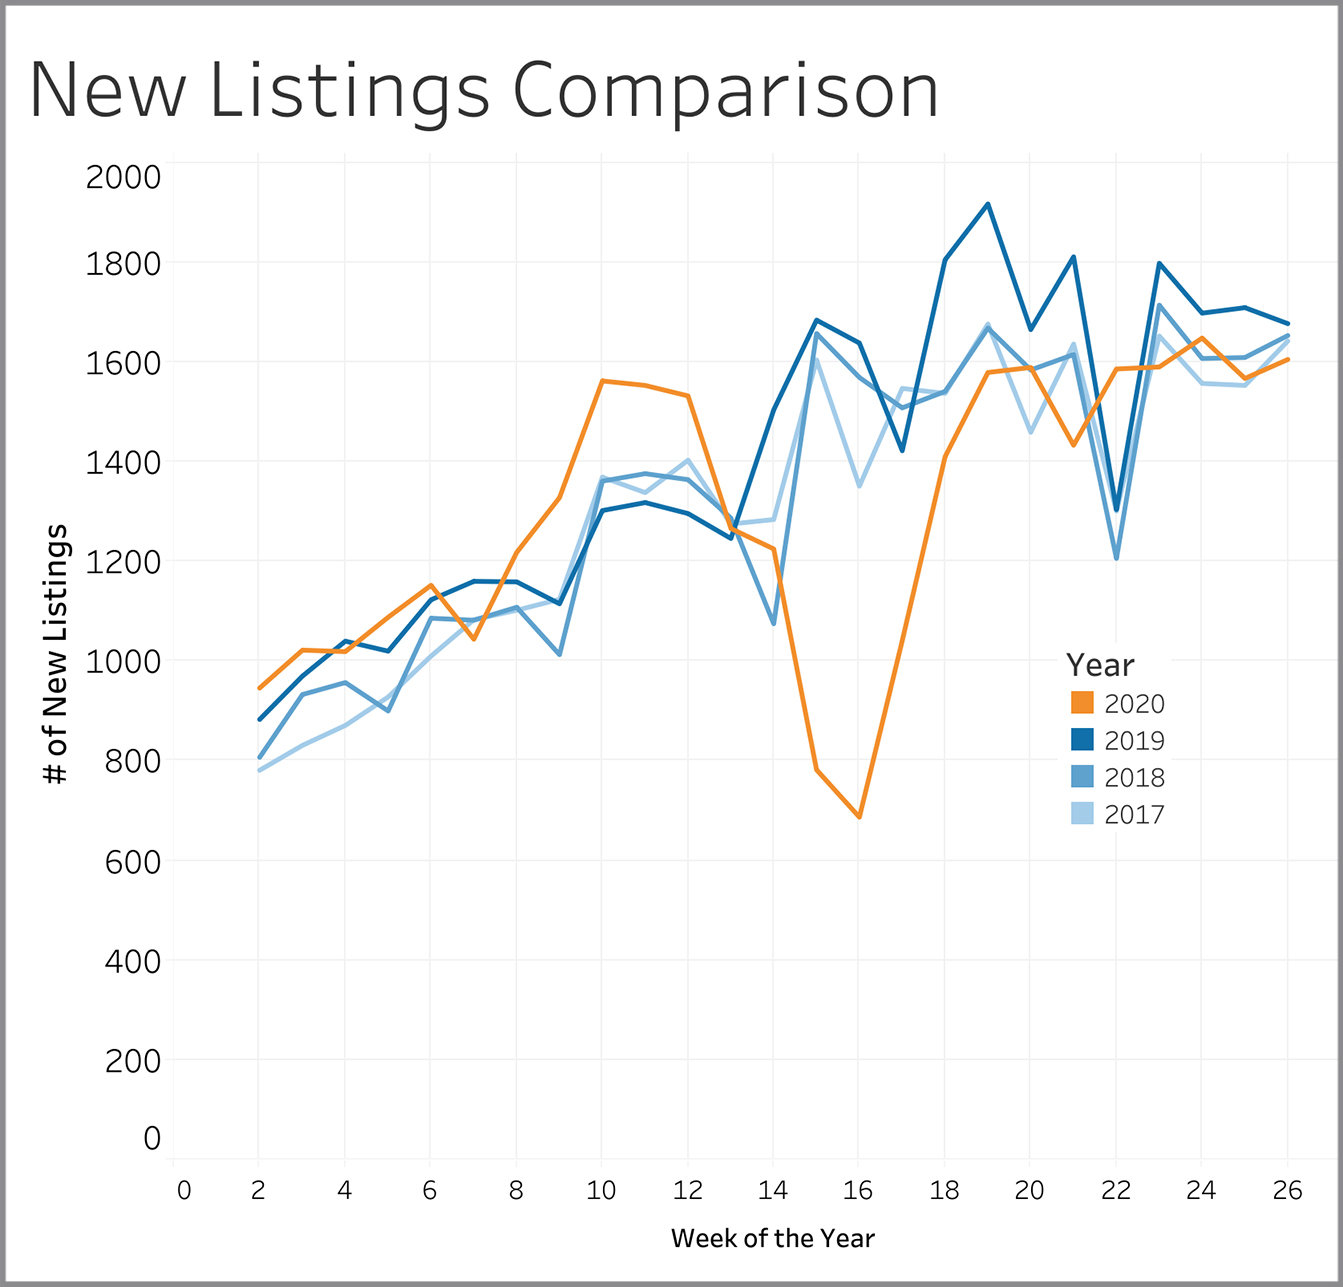
New Listings
New listings reflect seller attitudes on whether this is a good time to be selling. The number of new listings hitting the market is at the low end of normal with 1,605 in Week 26 compared with 1,642 to 1,677 in the three prior years.
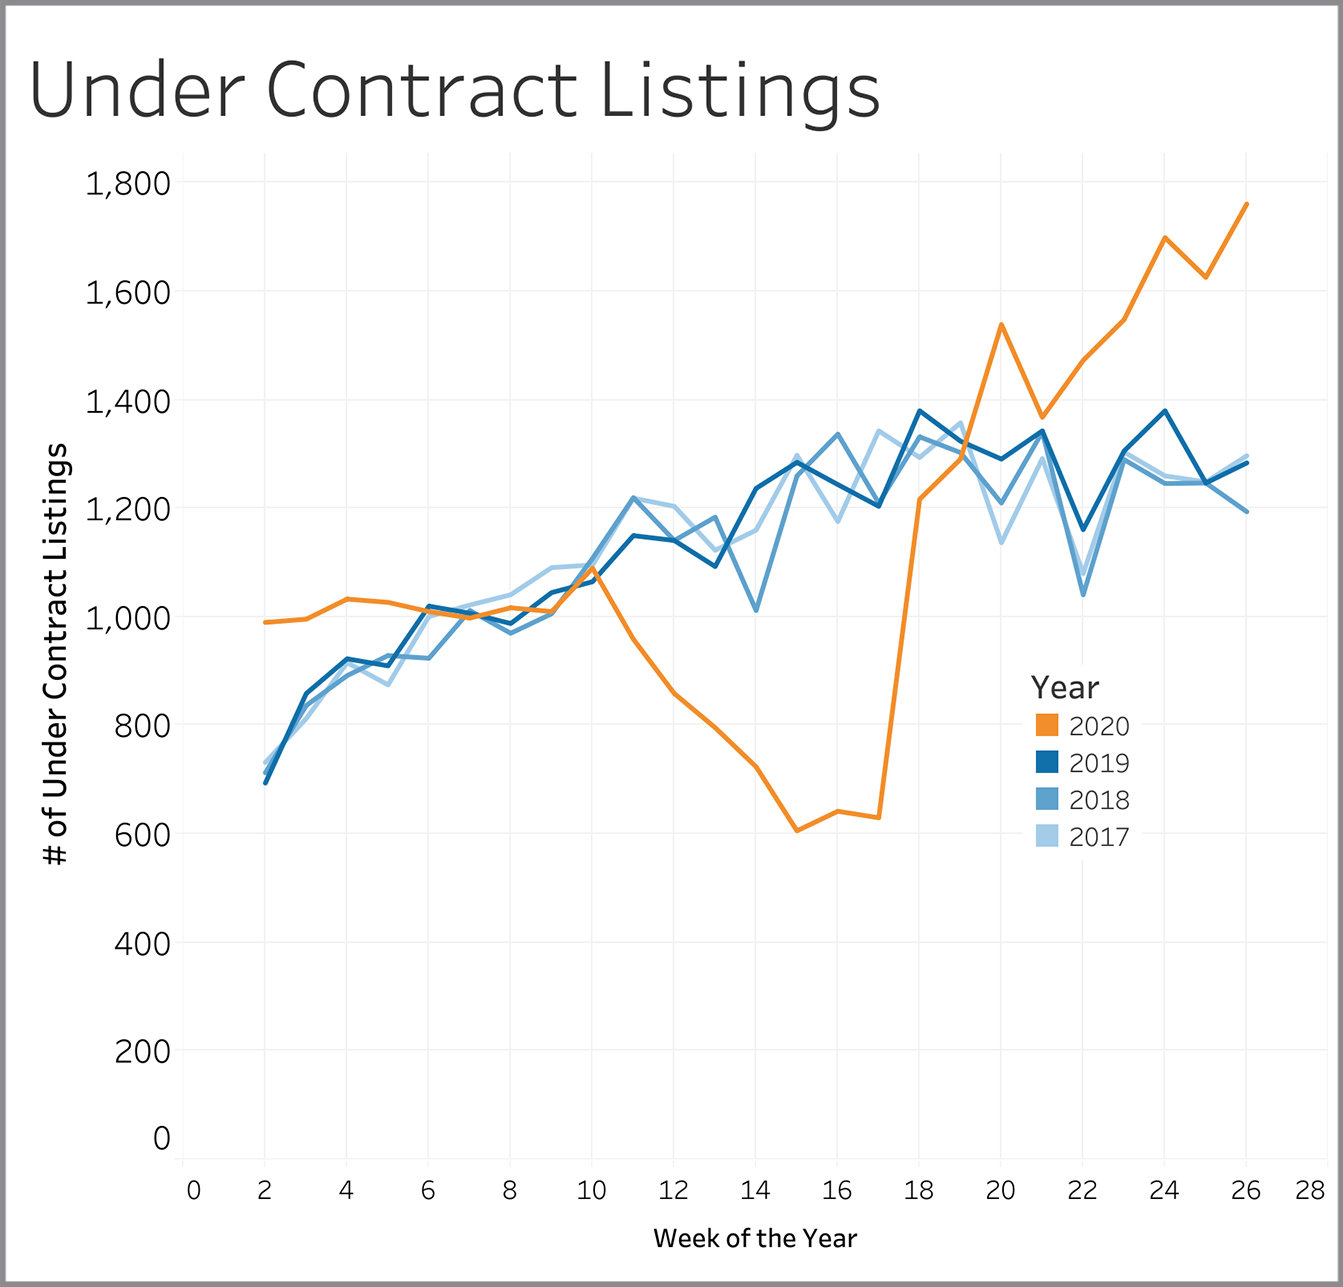
Under Contract Listings
Properties going under contract show us whether buyers are confident to do business in the current market environment. The number continues to soars with 1,716 homes finding a buyer in Week 26 compared to the 1,200 to 1,300 that is typical for this time of year.
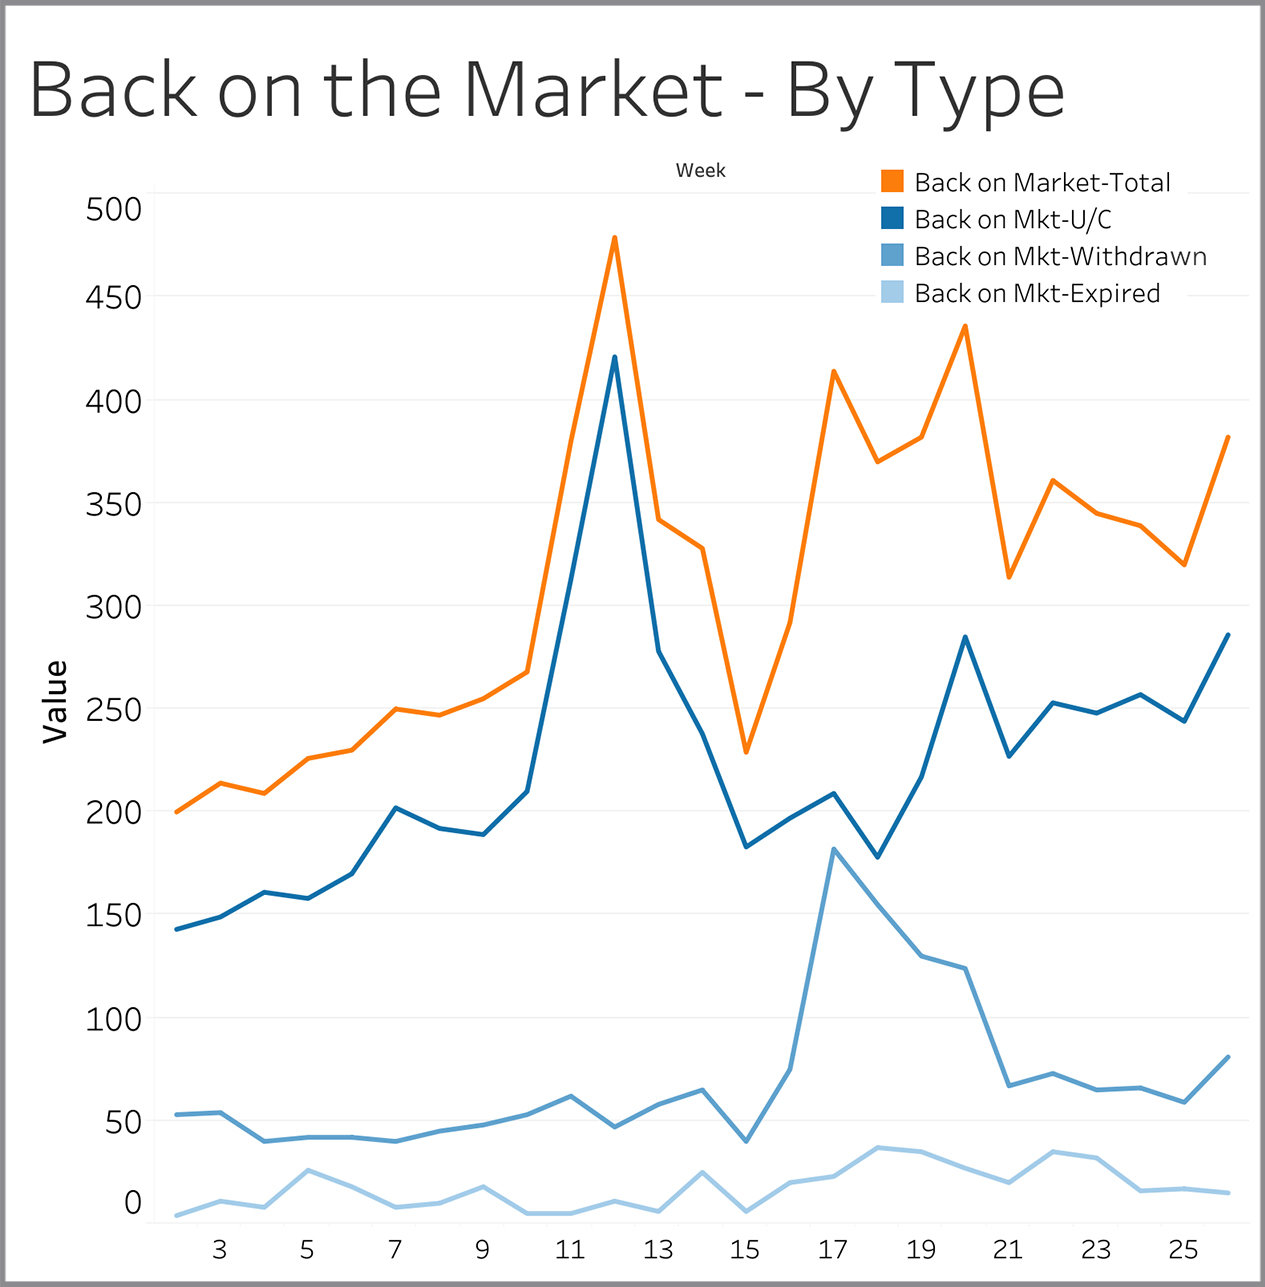
Back on Market – By Type
Listings come back on the market for three reasons: (1) Seller lost a deal with one buyer and are now looking for another one; (2) Seller took a break from showing the property and is now allowing showings again; (3) Seller let his/her listing expire and then came back to the market within 30 days with either the same agent or a different agent. Losing a buyer accounted for almost 75% of the properties coming back to the market in Week 26. The overall number of homes coming back on the market was 382 in Week 26, which is virtually unchanged from the 372 that feel apart in the same week a year ago.
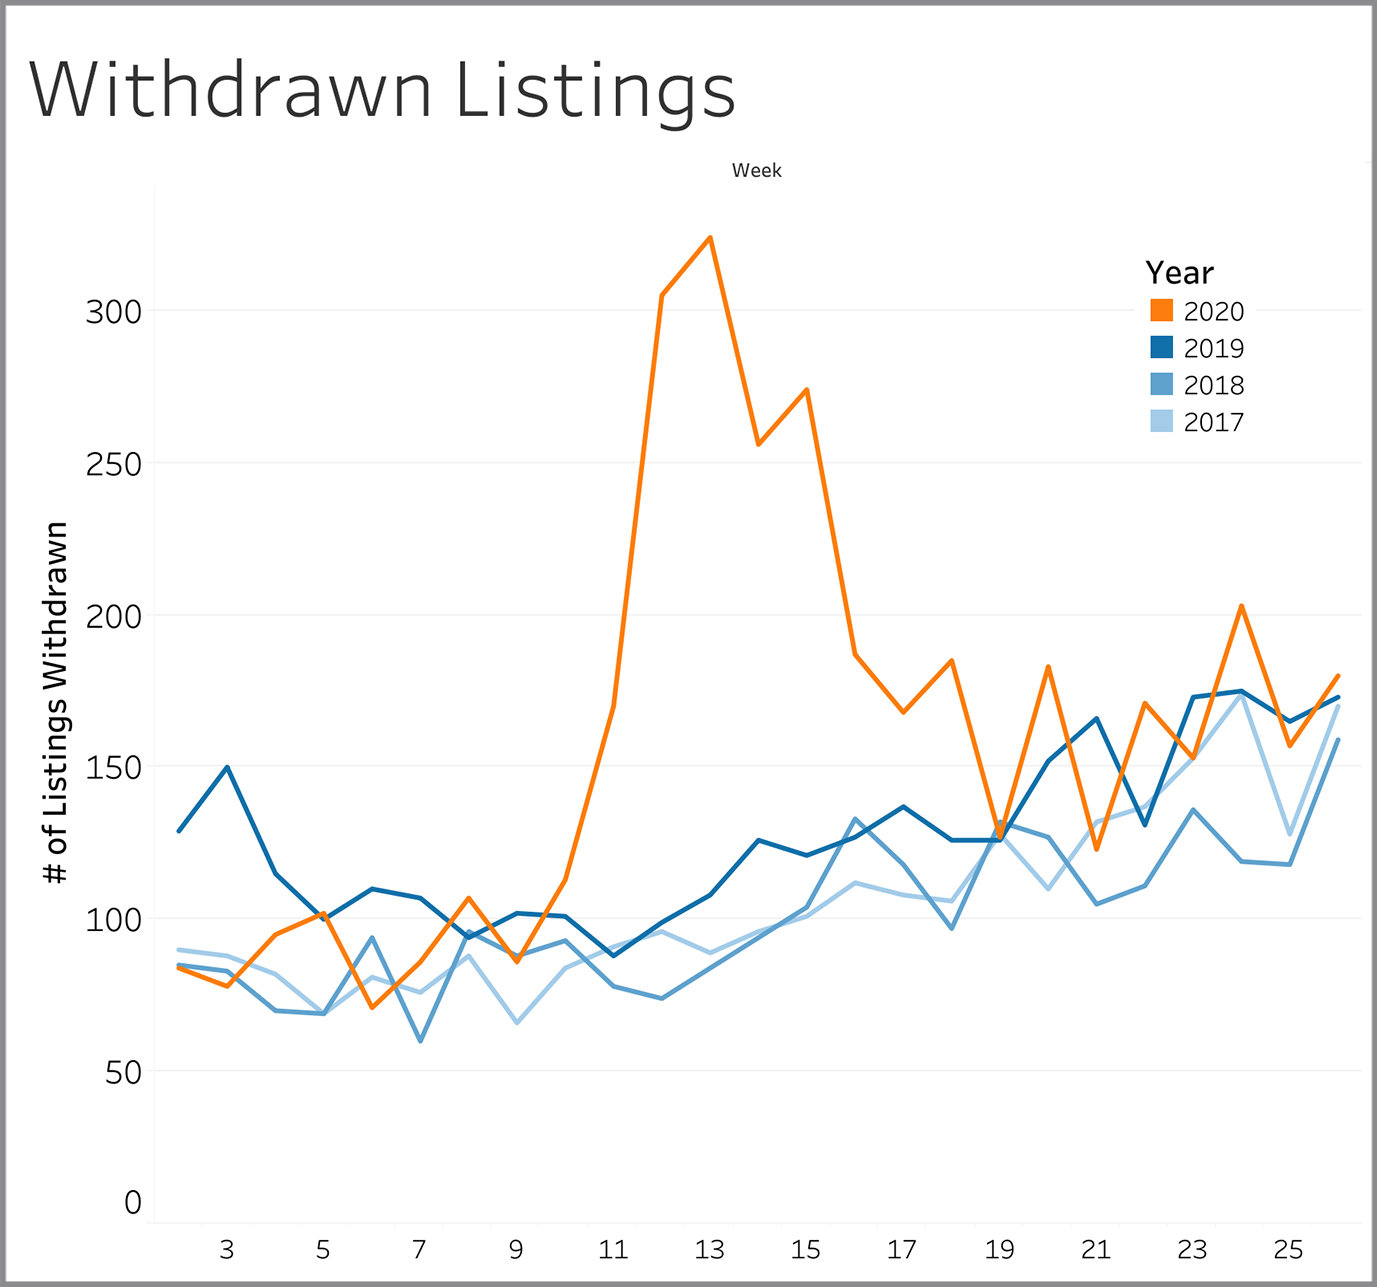
Withdrawn Listings
Withdrawn listings are sellers that have either given up altogether on selling or that have temporarily halted showings. The 180 withdrawn listings we saw in Week 26 is essentially unchanged from the 170 to 173 in each of the three prior years.
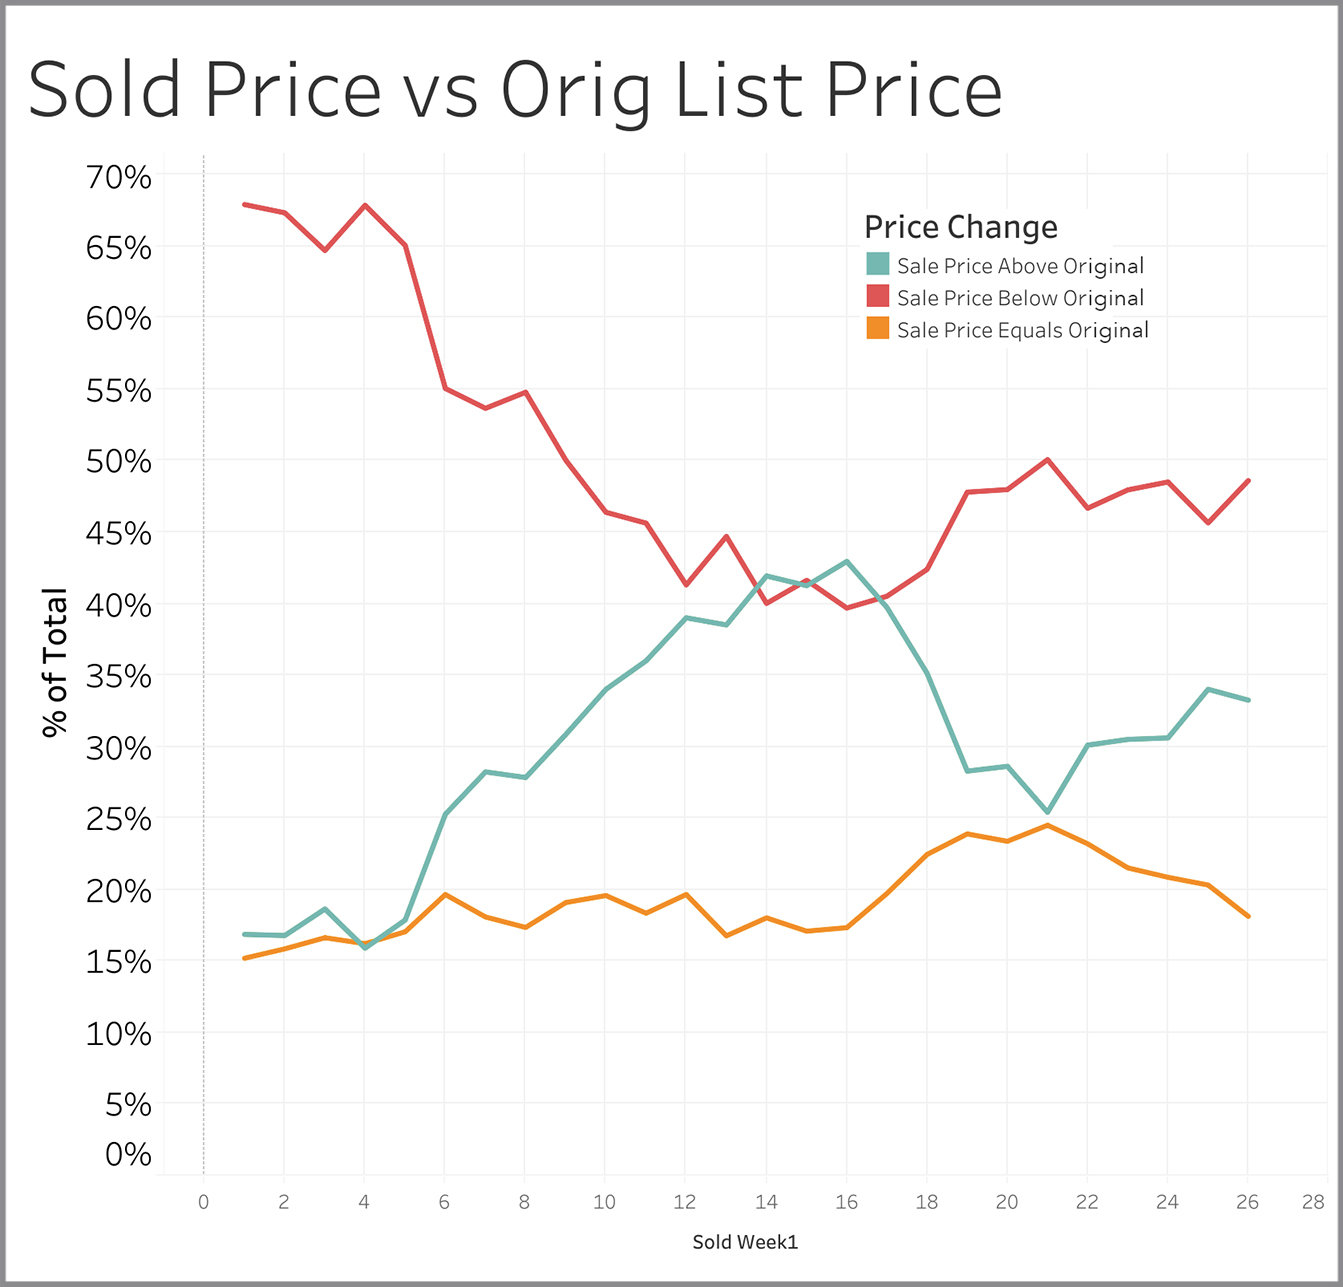
Sold Price vs. Original List Price
For the last few weeks, it has been a 50/50 split on this metric. Half of the sellers are getting at or above original asking price and the other half get something less than full price.
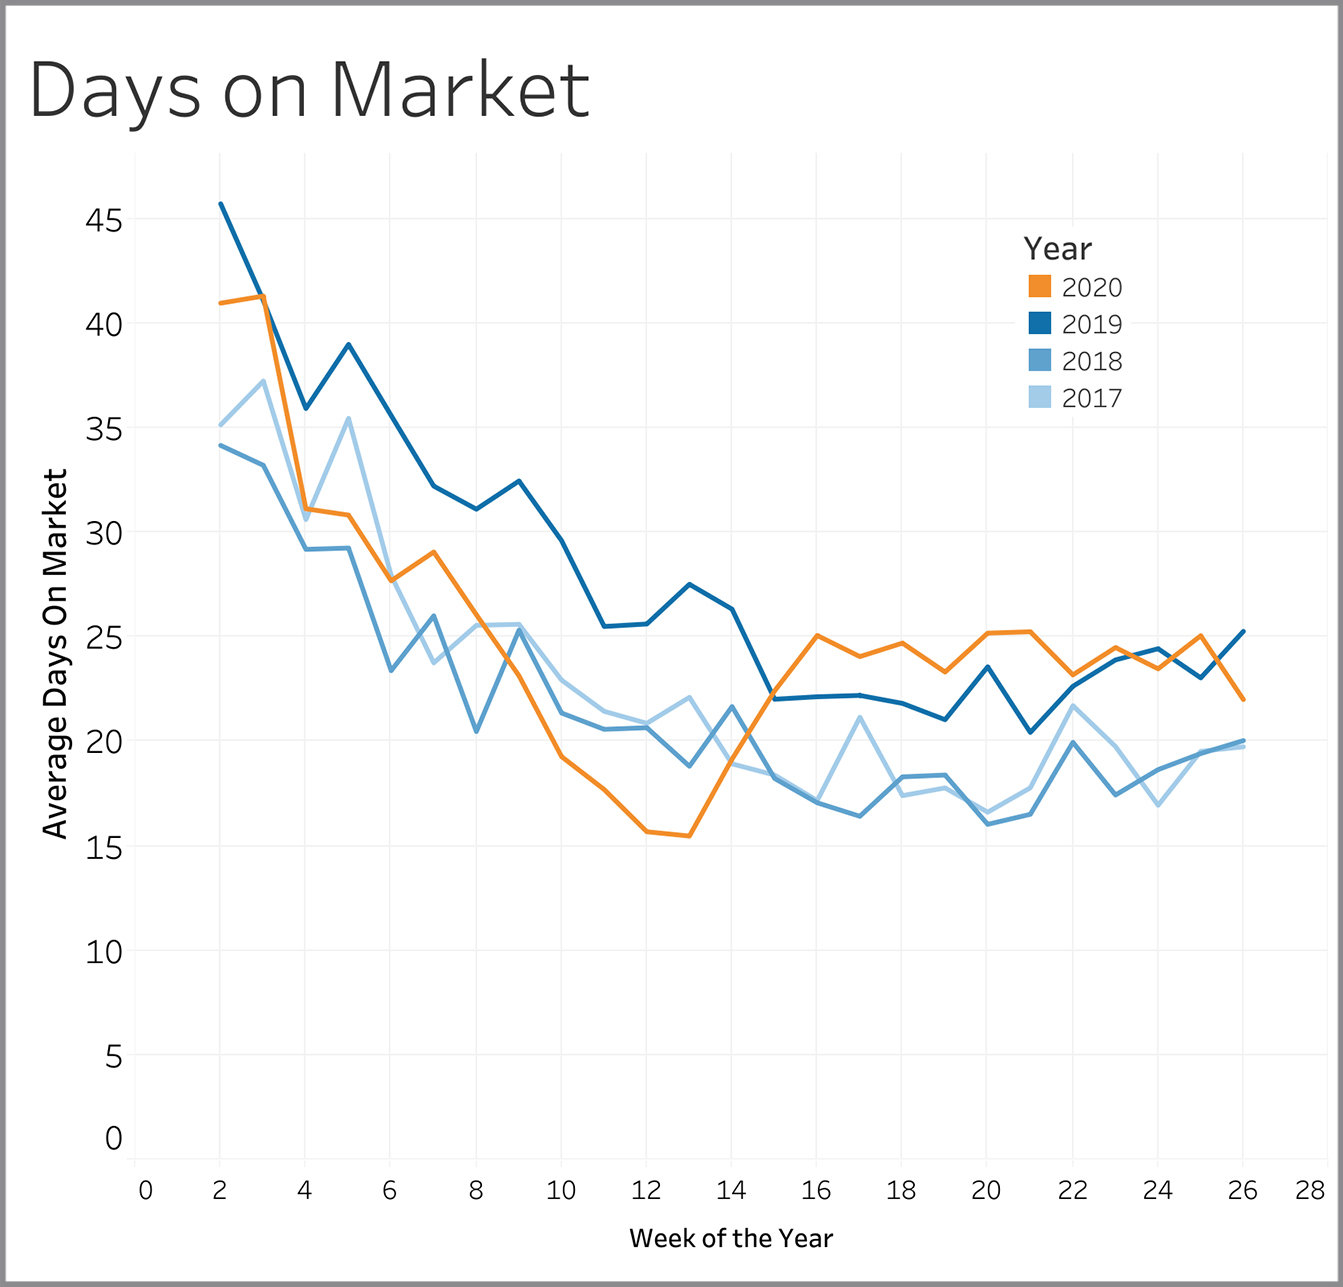
Days on Market
Days on market is measured from the time a property first comes on the market to when it goes under contract. For the last nine weeks, the number of days it takes to find a buyer has been in the range of 22 to 25 days and not significantly different from what was experienced in 2019.
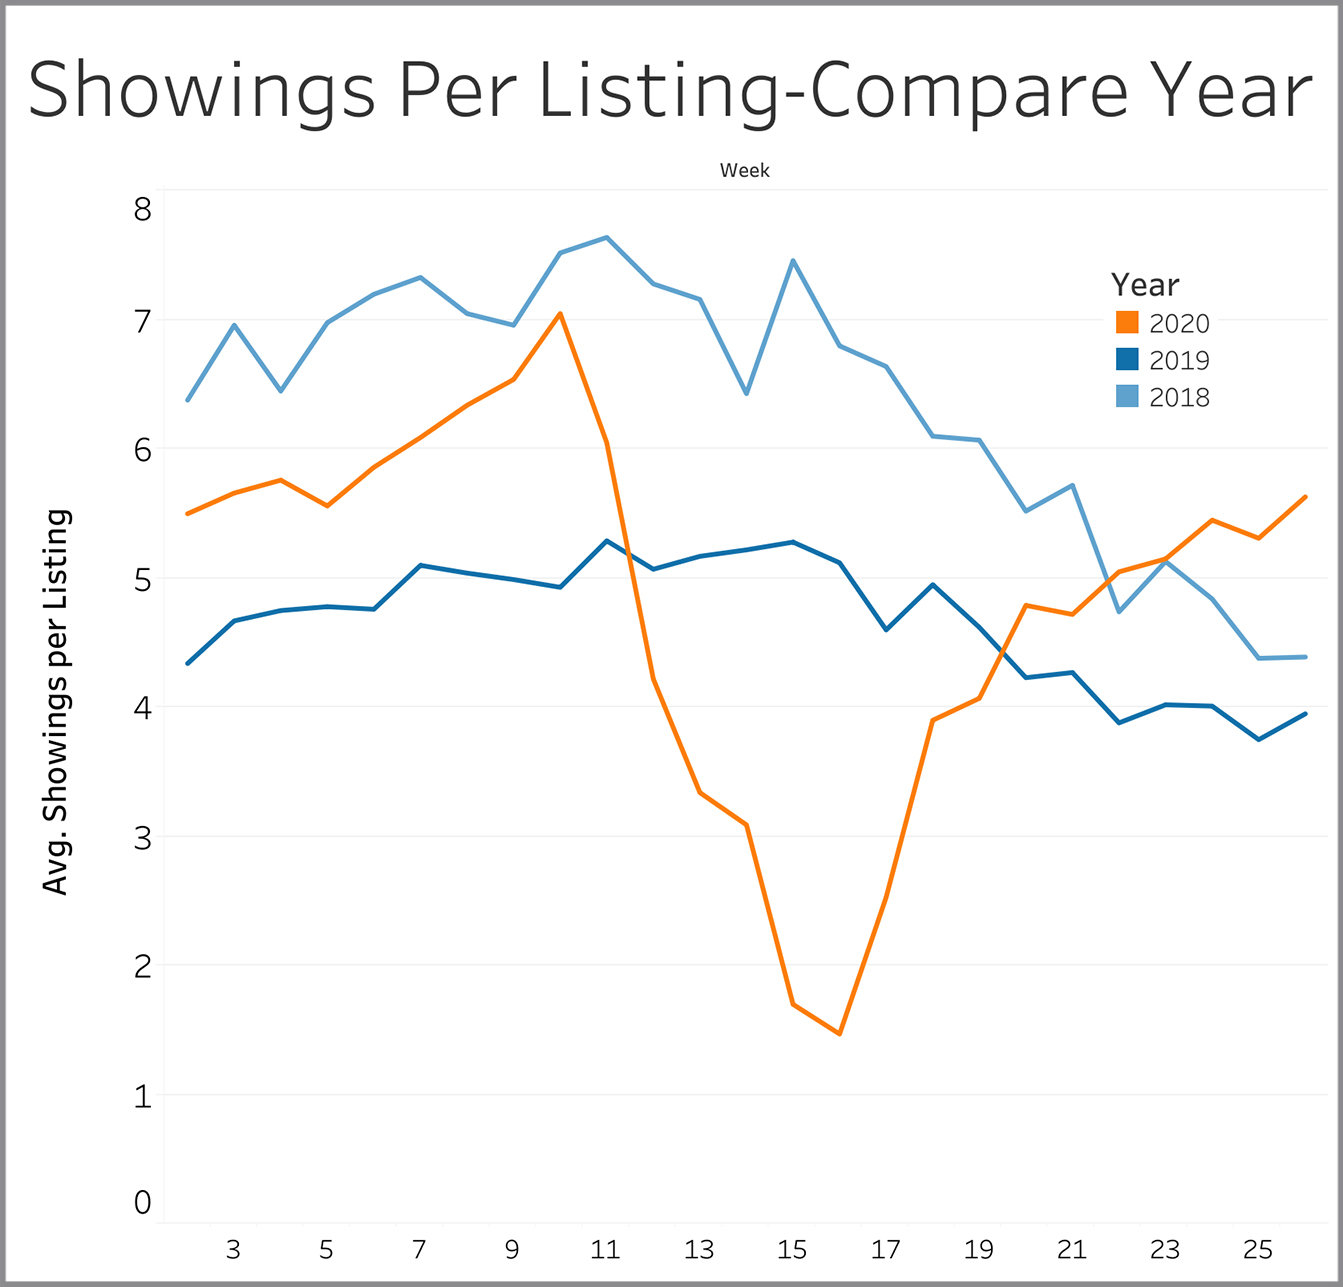
Showings Per Listing - Compare Year
We saw this metric decline consistently after Week 10, but the pattern reversed in Week 17 and is now somewhat higher than levels seen in 2018 and 2019. However, the absolute numbers are not all that different and translate into the average home receiving one additional showing per week. COVID concerns are not keeping buyers from seeing properties in person.
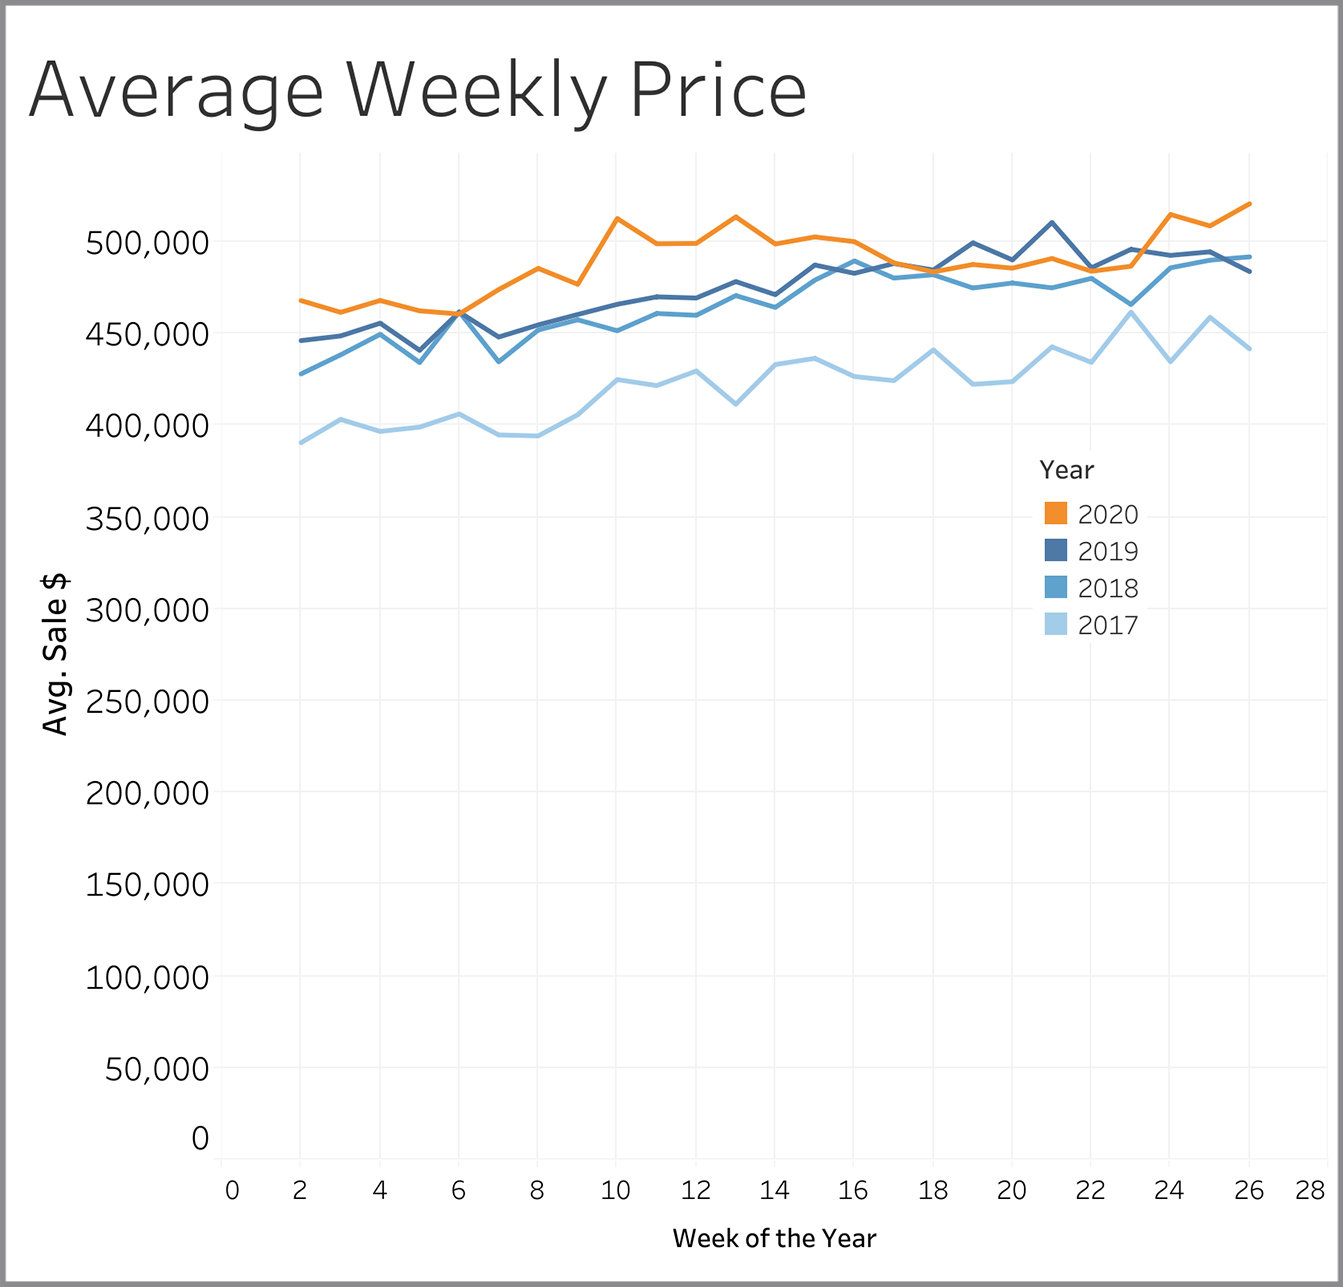
Average Weekly Price
The average price of properties closed in a given week reflects market conditions that existed about a month ago since it typically takes a month for a property to close once it goes under contract. Week 12 is when the first Stay at Home order was issued, and it is Week 16 (a month later) where the average price seems to start falling a bit. Stay at home restrictions started easing in Week 17 and showings were back at normal levels by Week 19. Now five weeks later, the average price has returned to the pattern of early in the year where it was running above 2019 levels. Home prices are up 7% from four weeks ago and up over 11% since the start of the year.
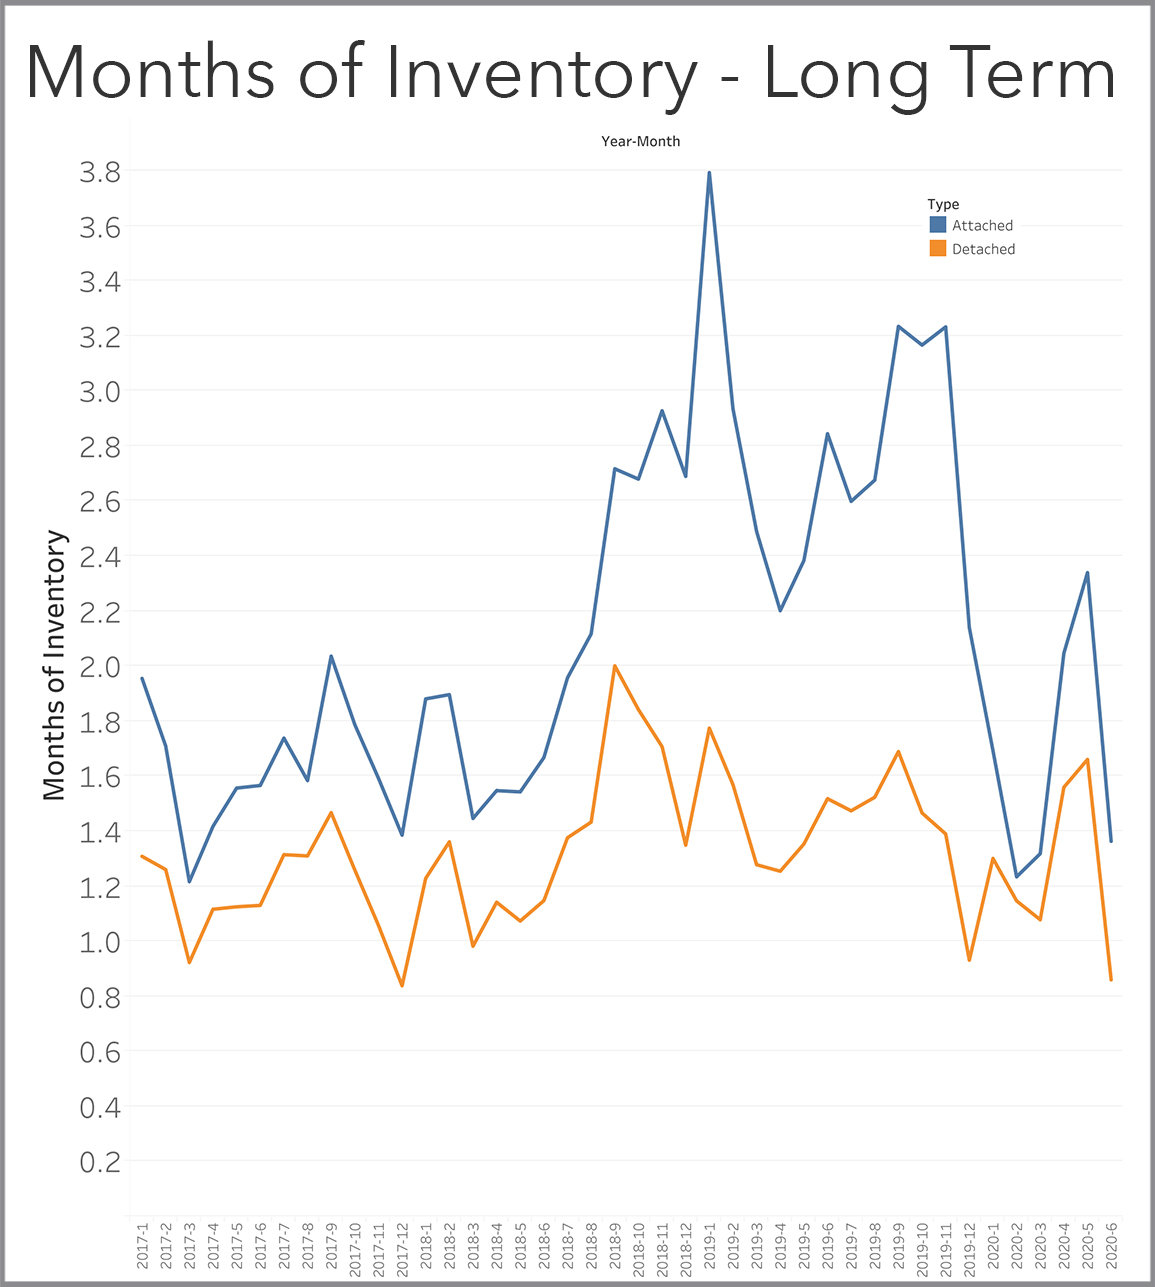
Months Of Inventory - Long Term
Months of inventory is computed by taking the rate at which homes are selling and dividing it into the number of homes available. It measures how long it would take to sell all the homes currently on the market if homes keep selling at the current rate. Anything less than 3 months is considered a seller’s market. The 0.86 months of inventory for detached single-family homes in June this year is the 2nd lowest value we’ve seen over the last 3½ year, eclipsed only by the 0.838 months of inventory in December 2017. The 1.363 months of inventory for attached single family homes (condos, townhouses, duplexes, etc.) is the 4th lowest value we’ve had in the last 42 months.