CHR STATE OF THE MARKET
Findings Through Week 22, 2020
(Week 22 began on May 27th and ended on June 2nd.)
The market is quickly recovering momentum lost when the shelter in place orders first came about in late March. The initial quarantine caused a significant drop in new homes coming on the market and that led to substantially fewer May closings. With stay at home orders significantly relaxed at the end of April, we’ve seen an unprecedented number of homes going under contract – 20% to 25% above what was typical for May in the three prior years.
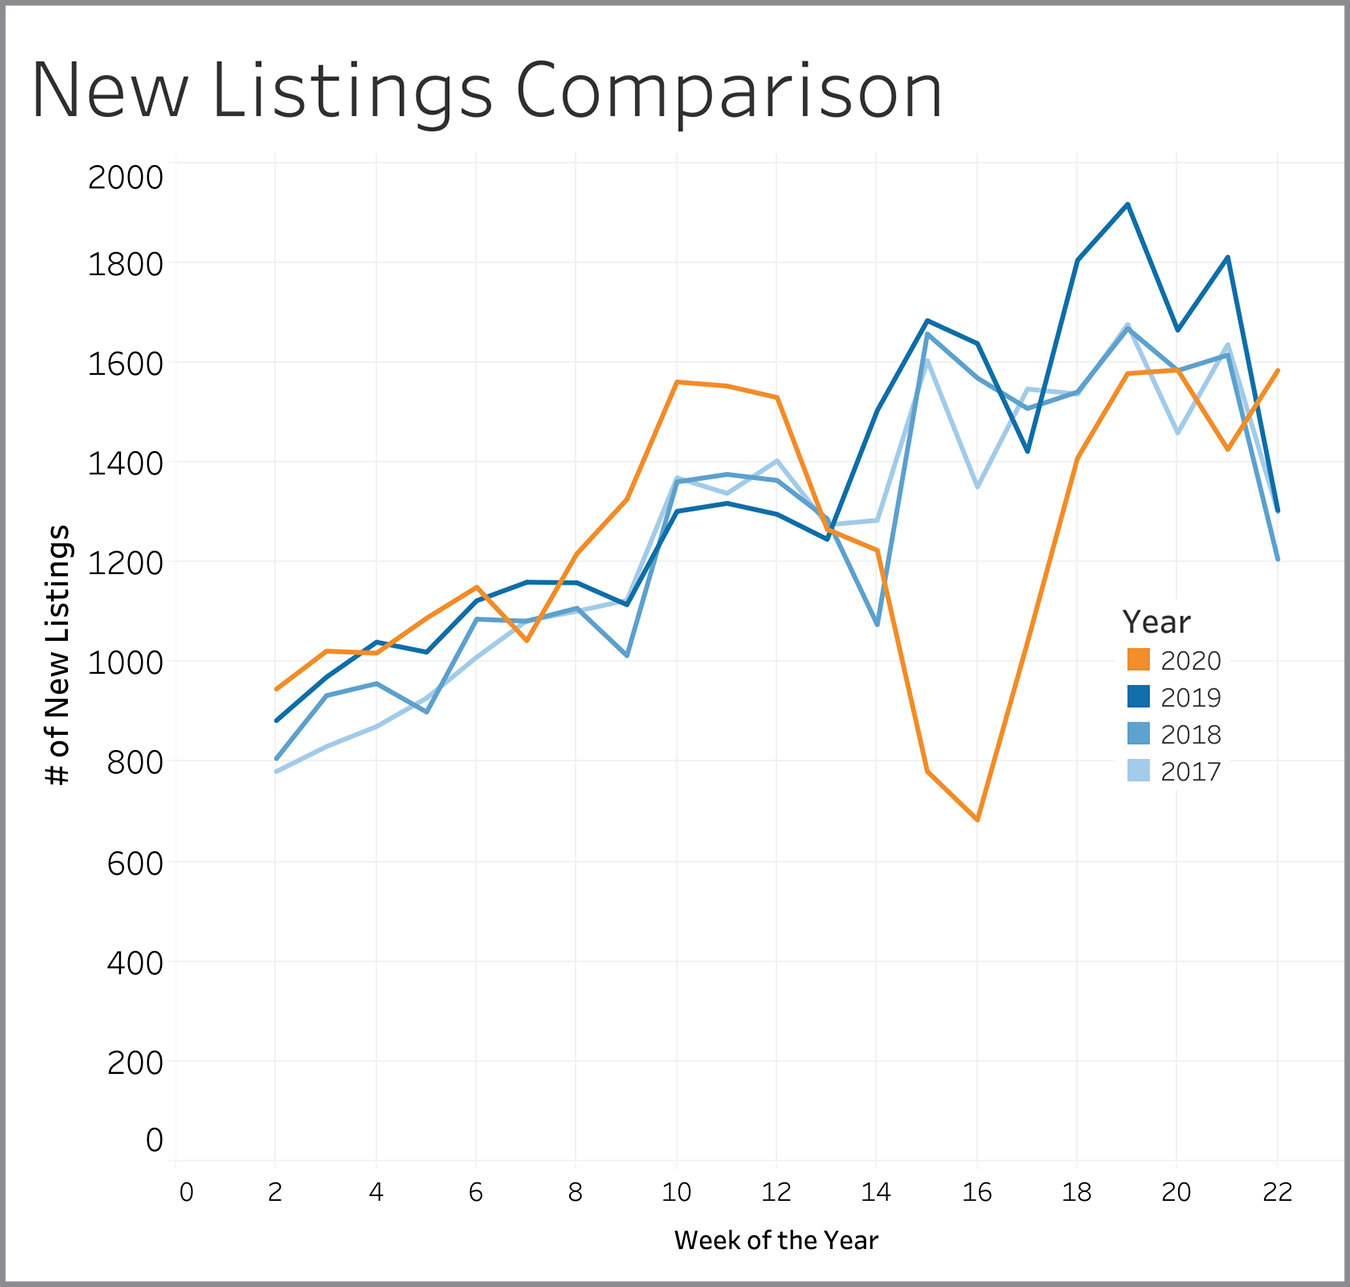
New Listings
New listings reflect seller attitudes on whether this is a good time to be selling. Week 22 continued the recovery in listing volume that started in Week 18. The number of new listing was 300 to 400 homes higher than levels we saw in during Week 22 during 2017, 2018 and 2019.
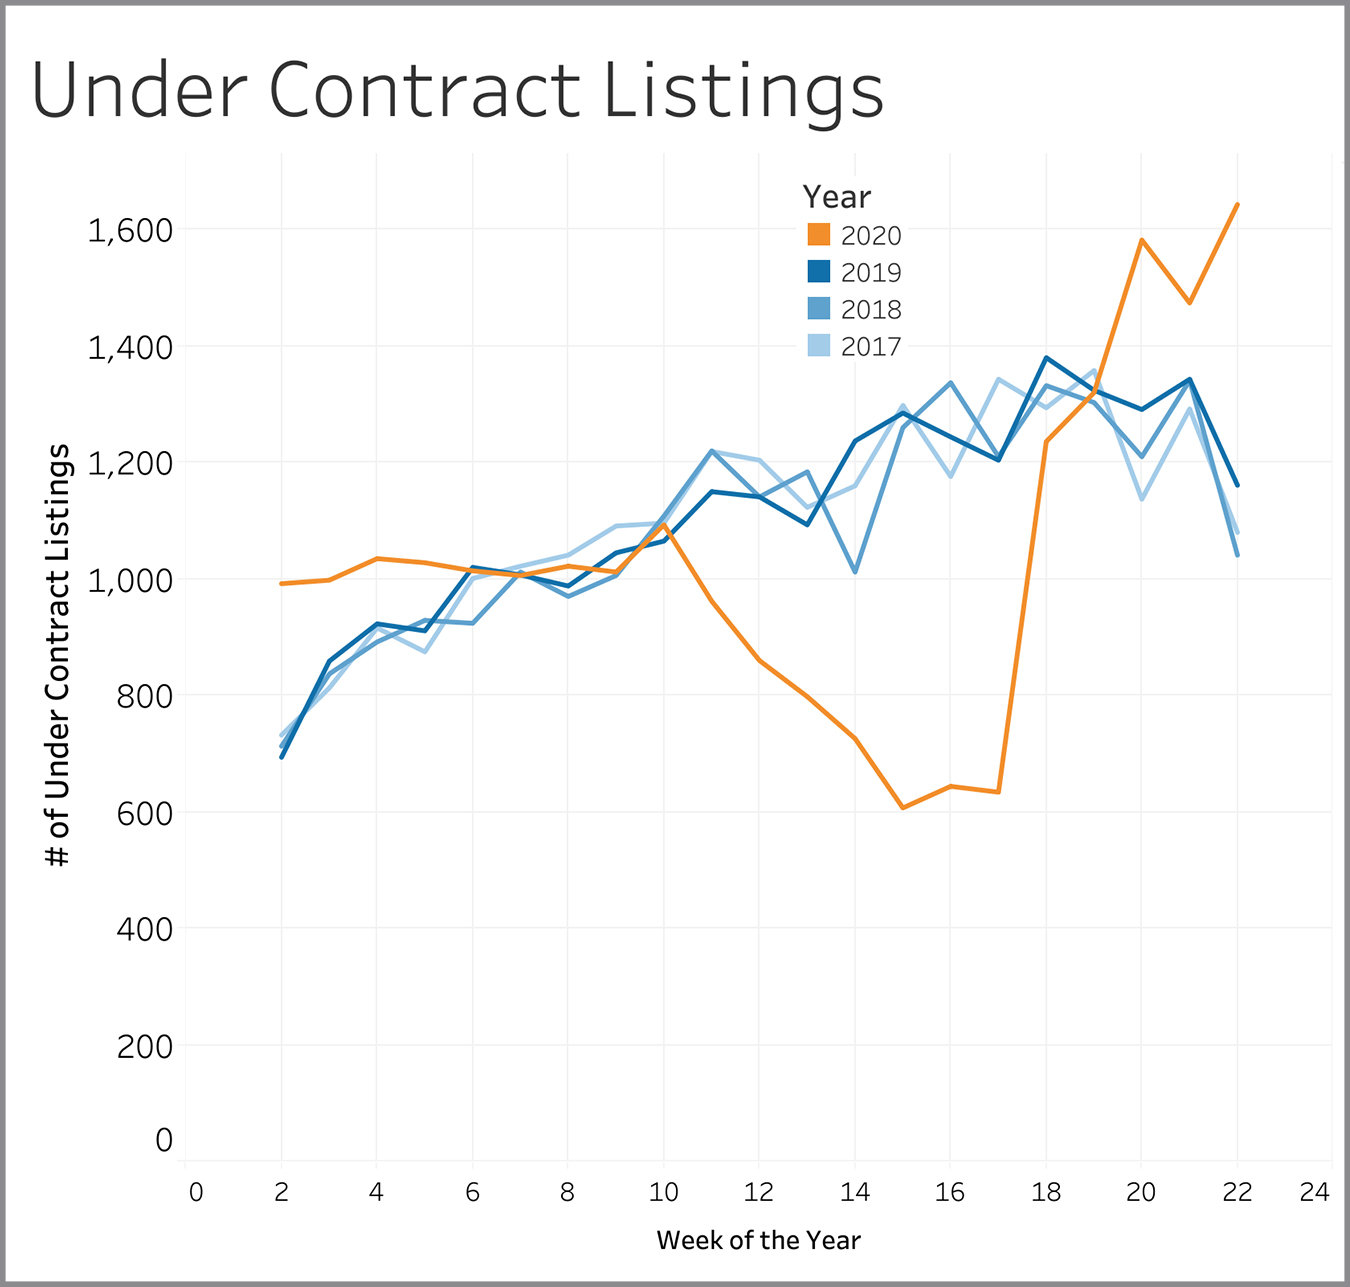
Under Contract Listings
Properties going under contract show us whether buyers are confident to do business in the current market environment. Week 22 had 500 to 600 more homes going under contract than in the prior three years. This continues the trend started three weeks ago when buyers began snatching up homes at a much higher rate than is normal for this time of year.
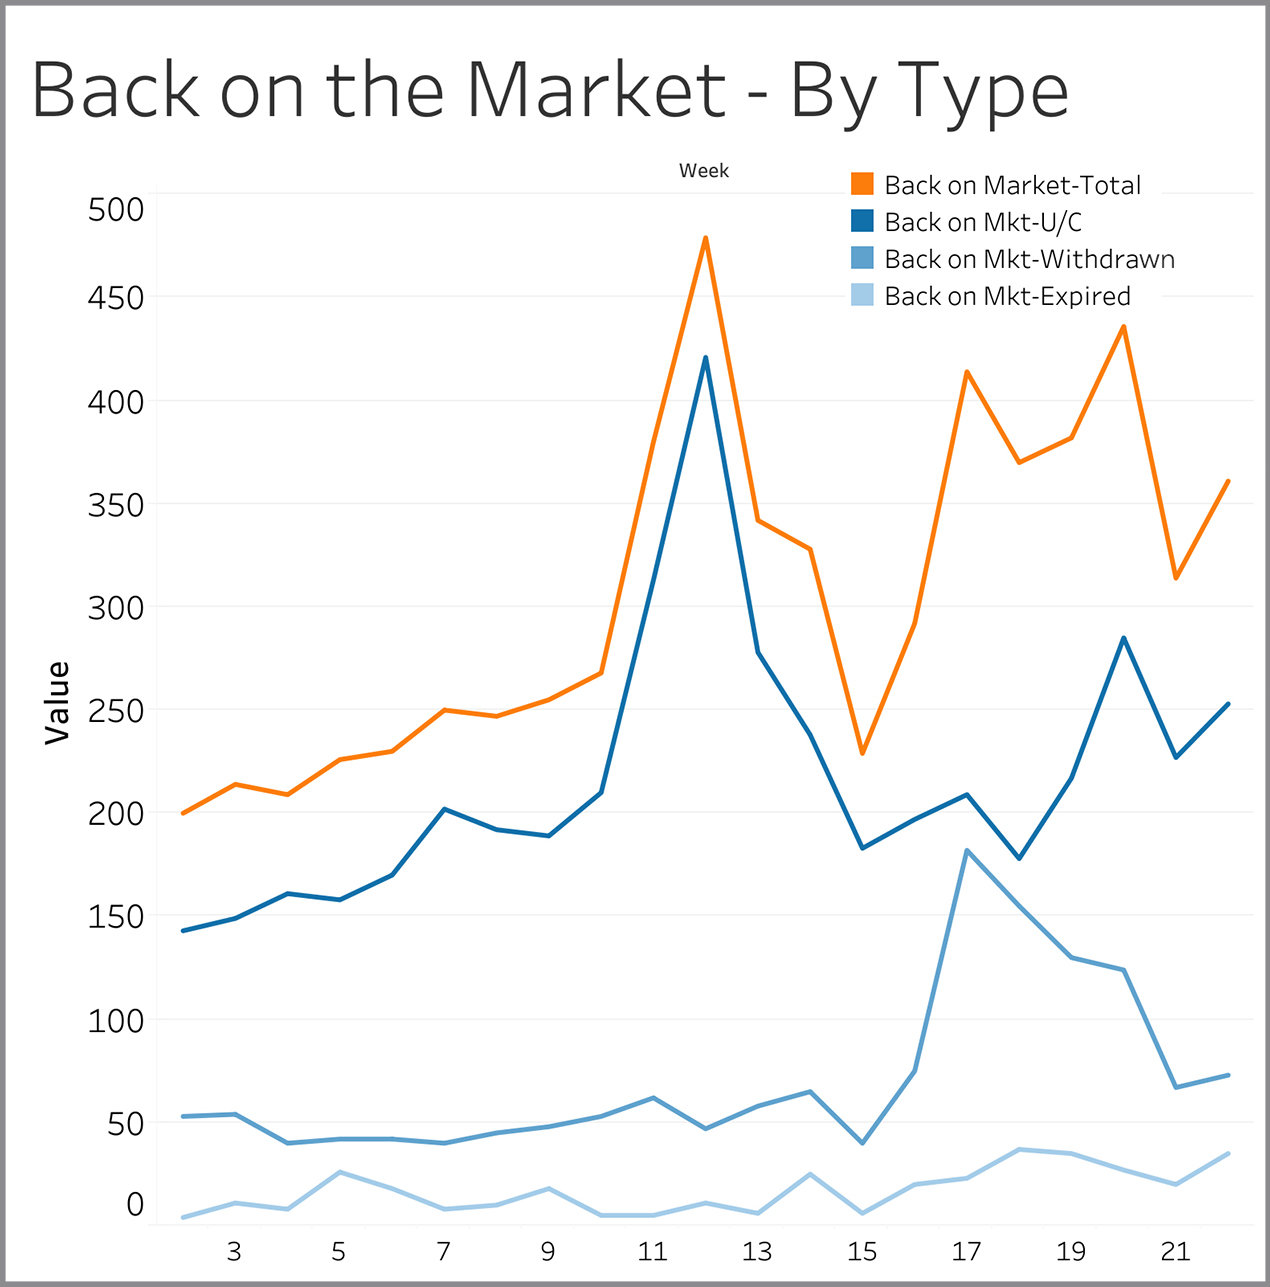
Back on Market – By Type
Listings come back on the market for three reasons: (1) Seller lost a deal with one buyer and are now looking for another one; (2) Seller took a break from showing the property and is now allowing showings again; (3) Seller let his/her listing expire and then came back to the market within 30 days with either the same agent or a different agent. Losing a buyer accounted for almost 70% of the properties coming back to the market in Week 20. The overall number of homes coming back on the market continues to run somewhat above normal – around 360 in Week 22 versus the 200 to 300 that was typical in the three prior years (data on prior years not shown on this chart).
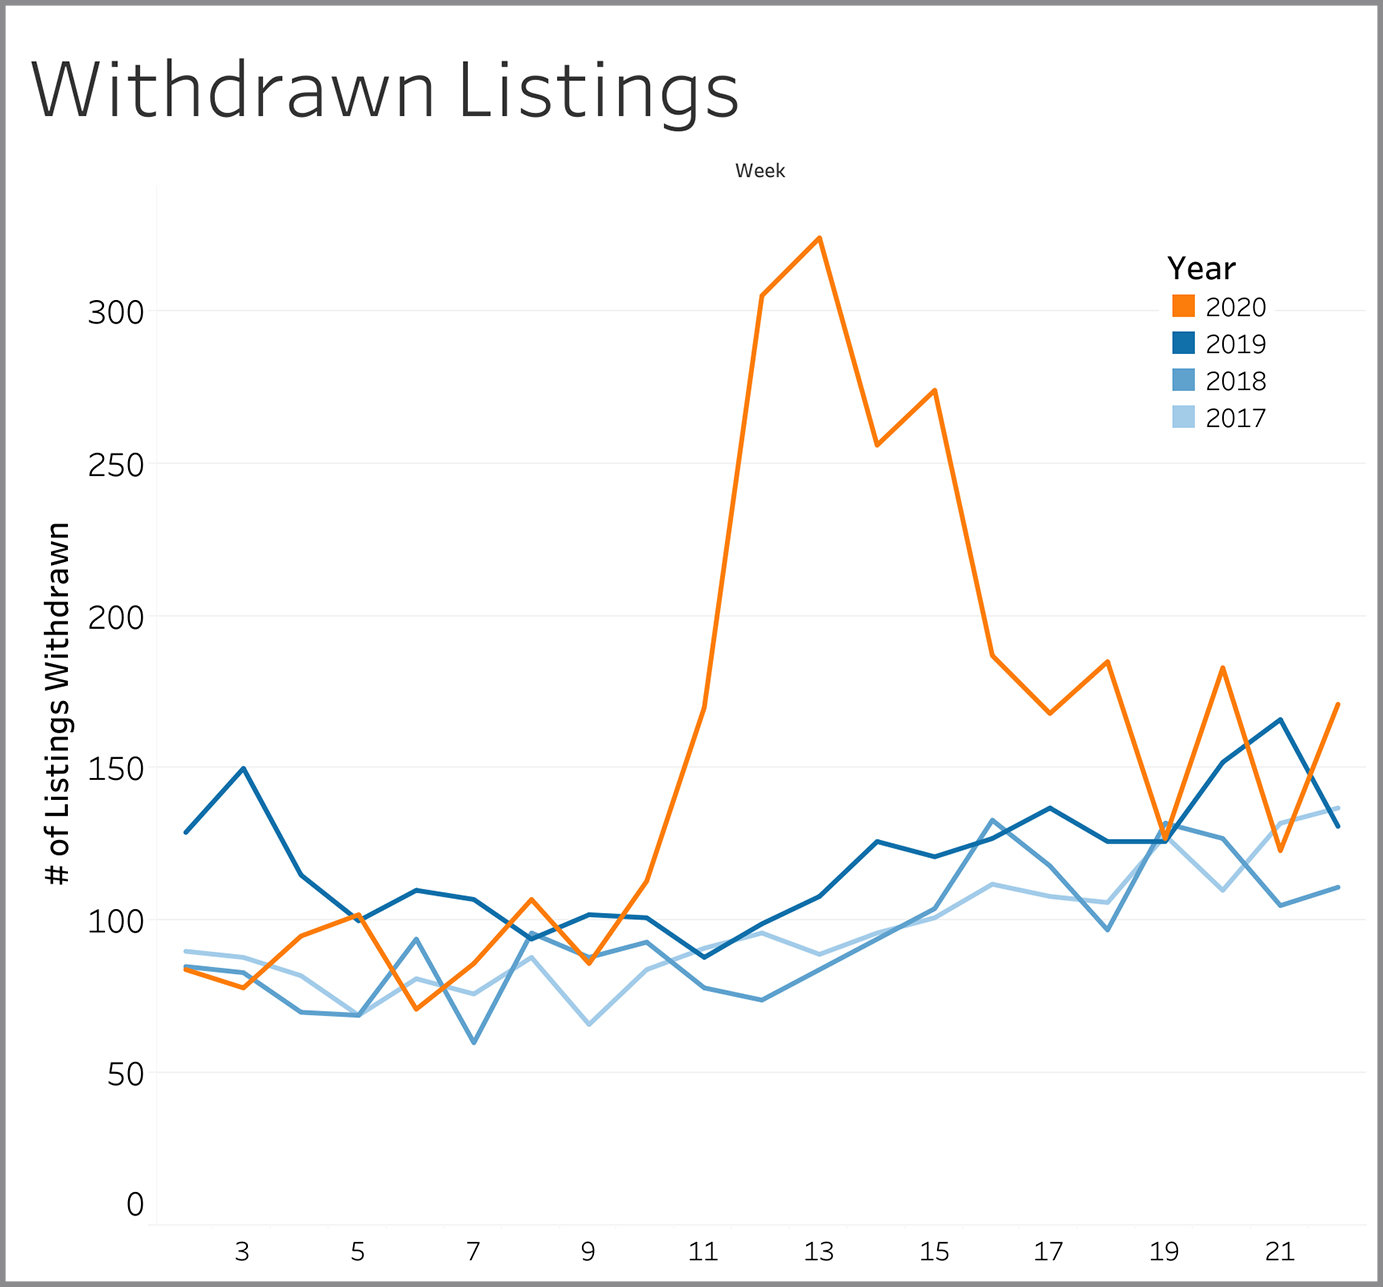
Withdrawn Listings
Withdrawn listings are sellers that have either given up altogether on selling or that have temporarily halted showings. At roughly 170 in Week 22, it is slightly above the norm of 110 to 130 established in 2017 through 2019.
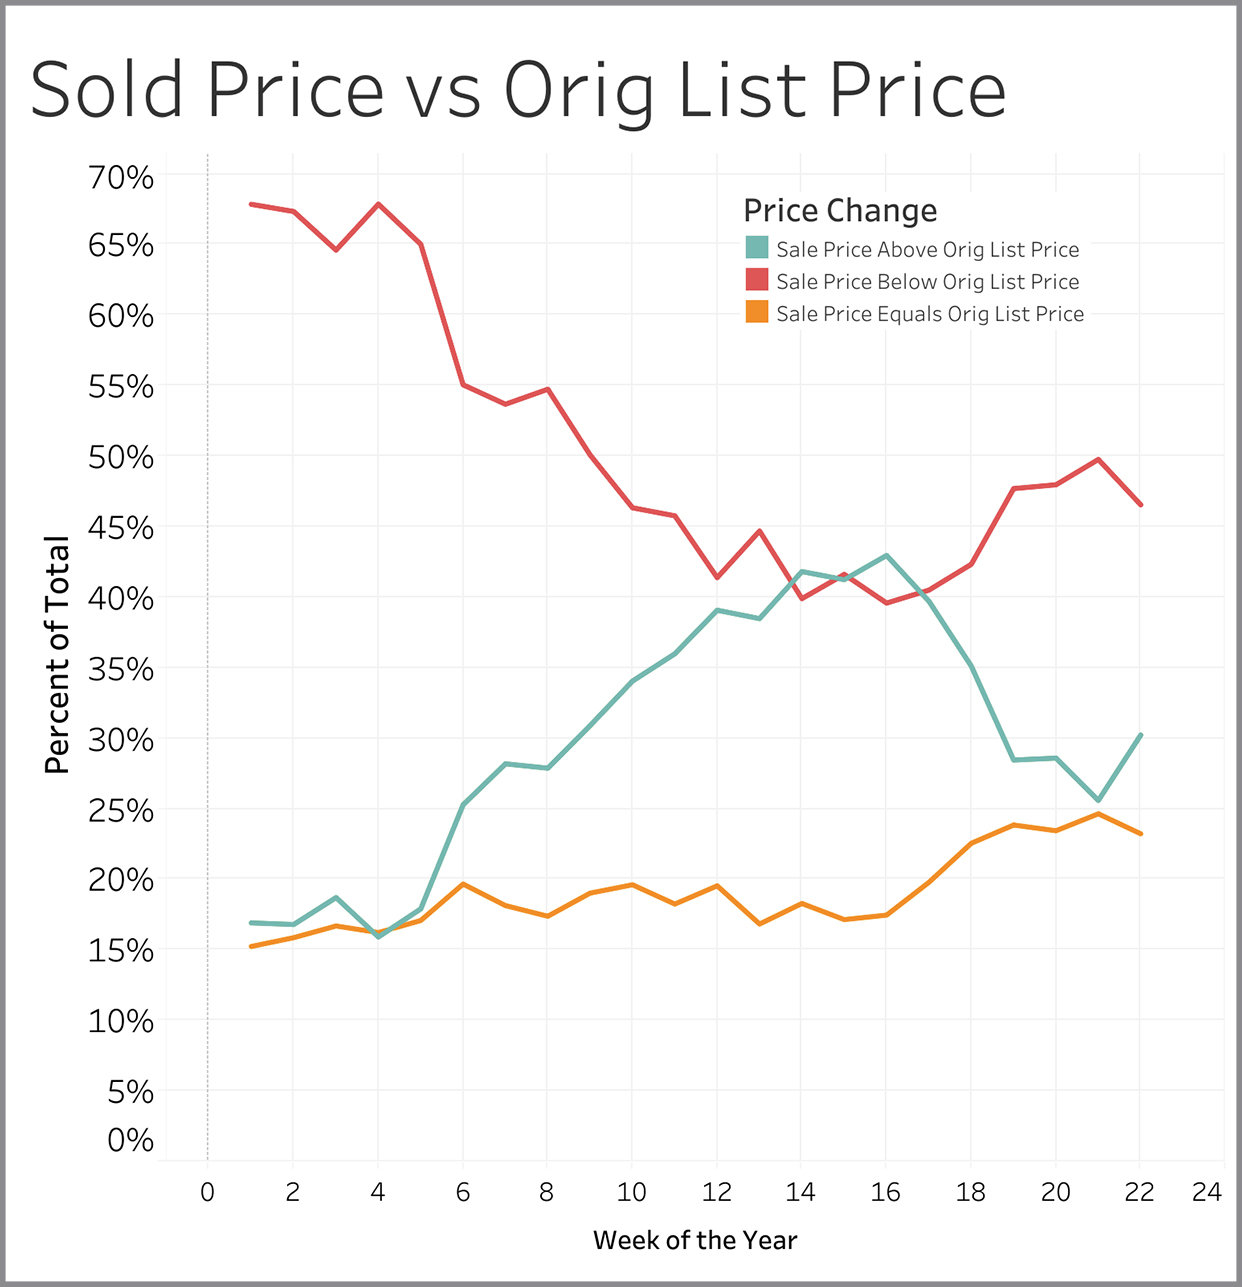
Sold Price vs. Original List Price
The number of sellers getting more than asking price is growing again. Close to one-third of all sellers received more than asking price in Week 22 versus about one-quarter achieving that in Week 21. Low inventory is causing many multiple offer situations and causing 53% of homes in Week 22 to be sold at or above asking price.
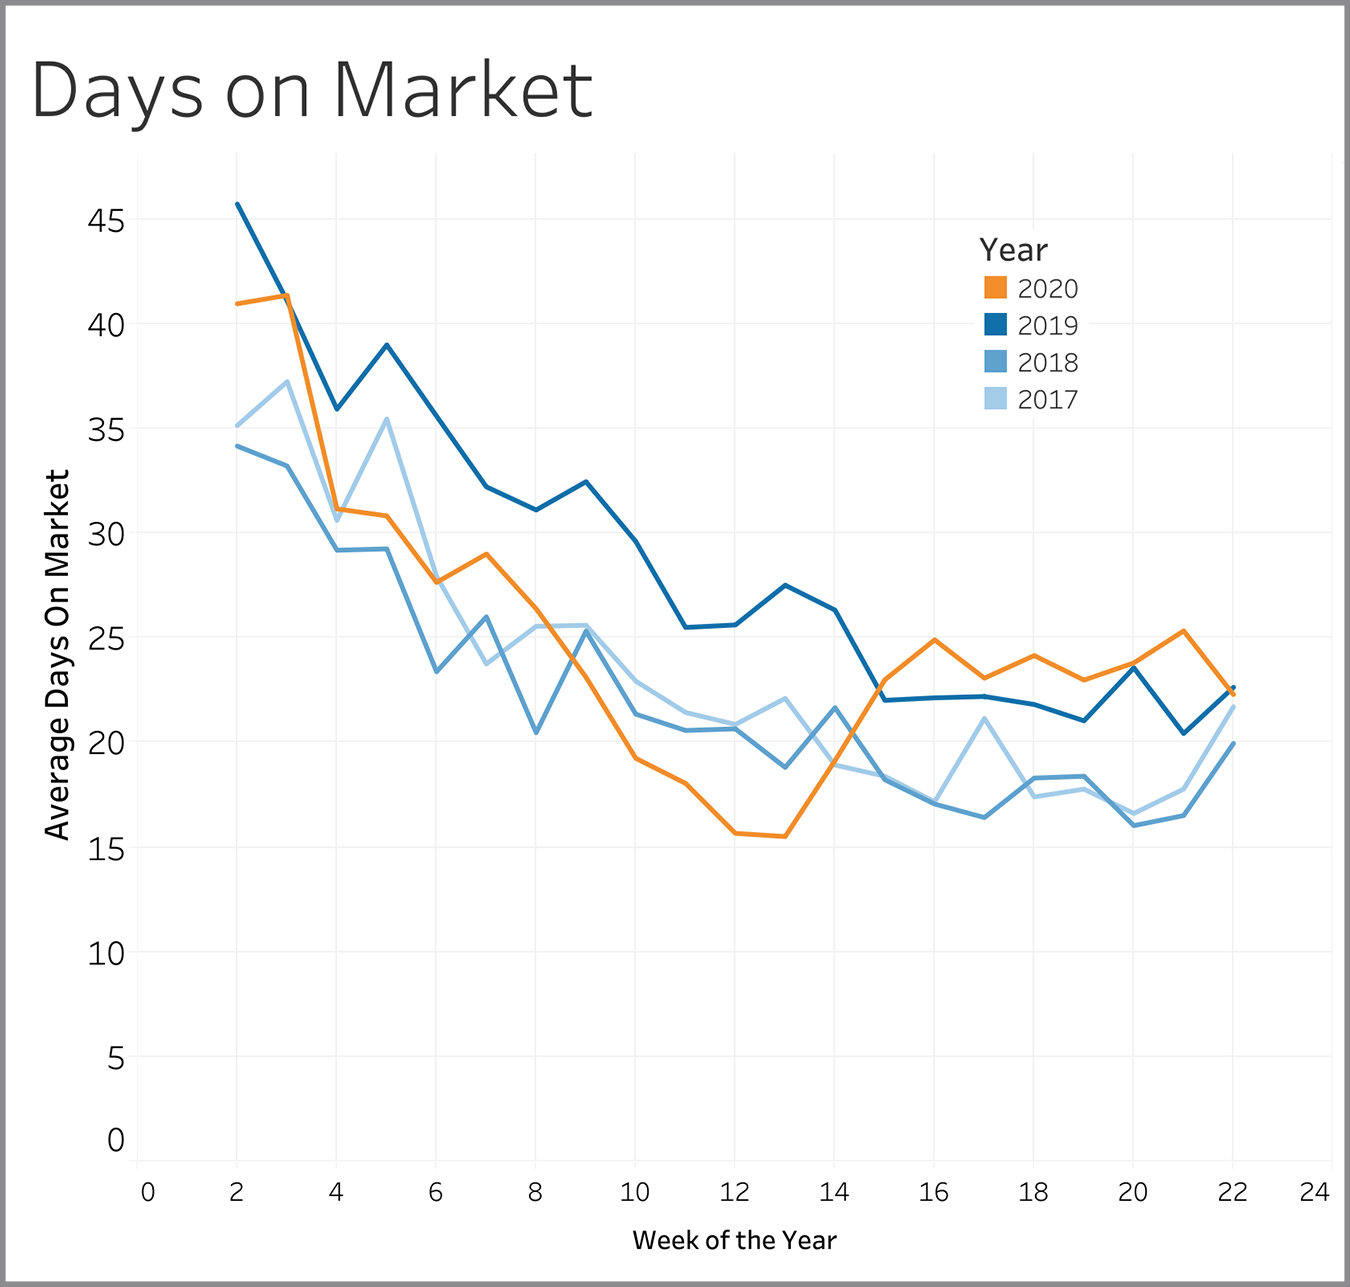
Days on Market
Days on market is measured from the time a property first comes on the market to when it goes under contract. For the last eight weeks, the number of days it takes to find a buyer has been in the 23 to 25 day range and that is very comparable to what was experienced in 2019.
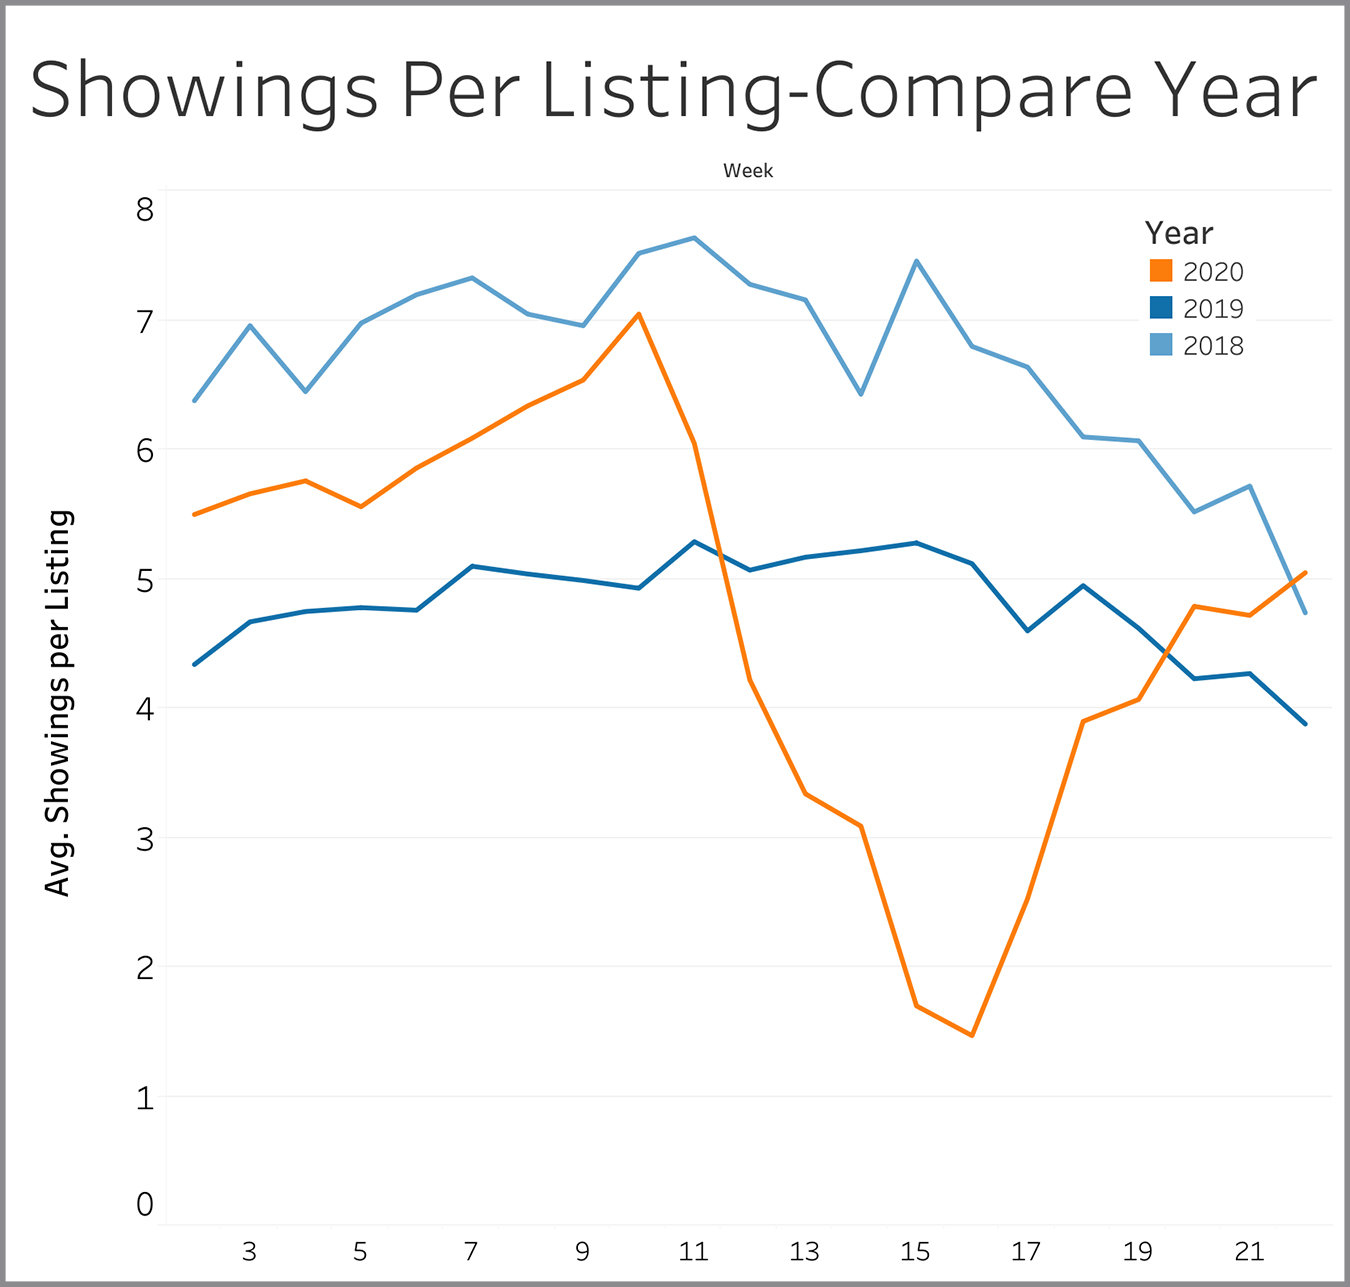
Showings Per Listing - Compare Year
We saw this metric decline consistently after Week 10, but the pattern reversed in Week 17 and has returned to normal levels for this time of year.