CHR WEEKLY
Findings Through Week 16, 2020
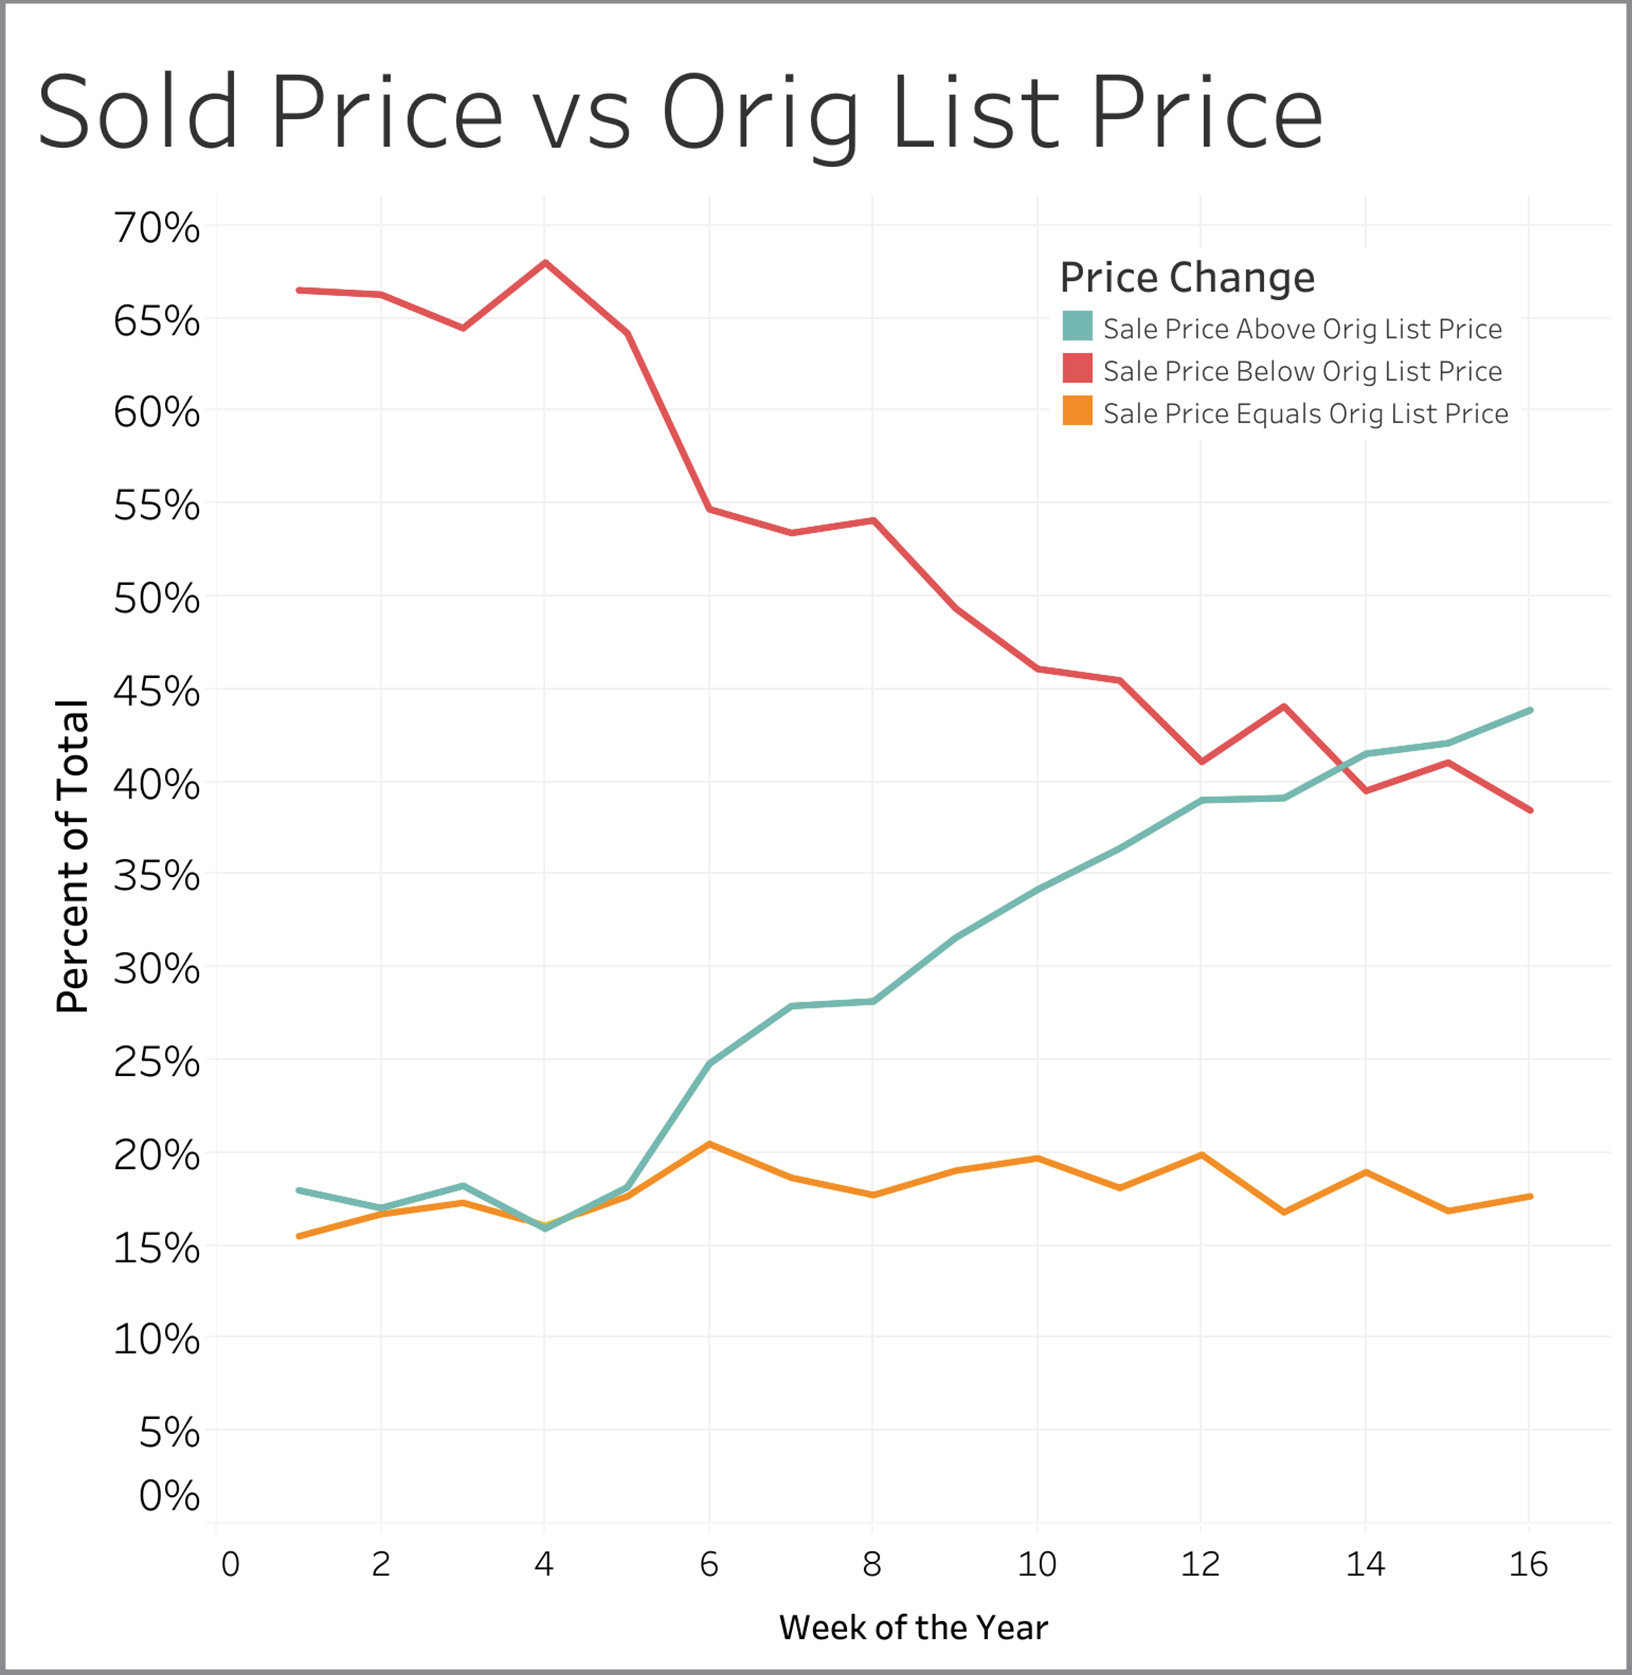
Buyers and sellers have hit the pause button in equal numbers, which is keeping inventory low and the market continuing to favor sellers. As a result, over 63% of the homes sold last week had a sale price that was at or above the seller’s asking price. With the governor’s statement that in-person showings can resume starting April 27th, we are expecting a surge in buying and selling activity.
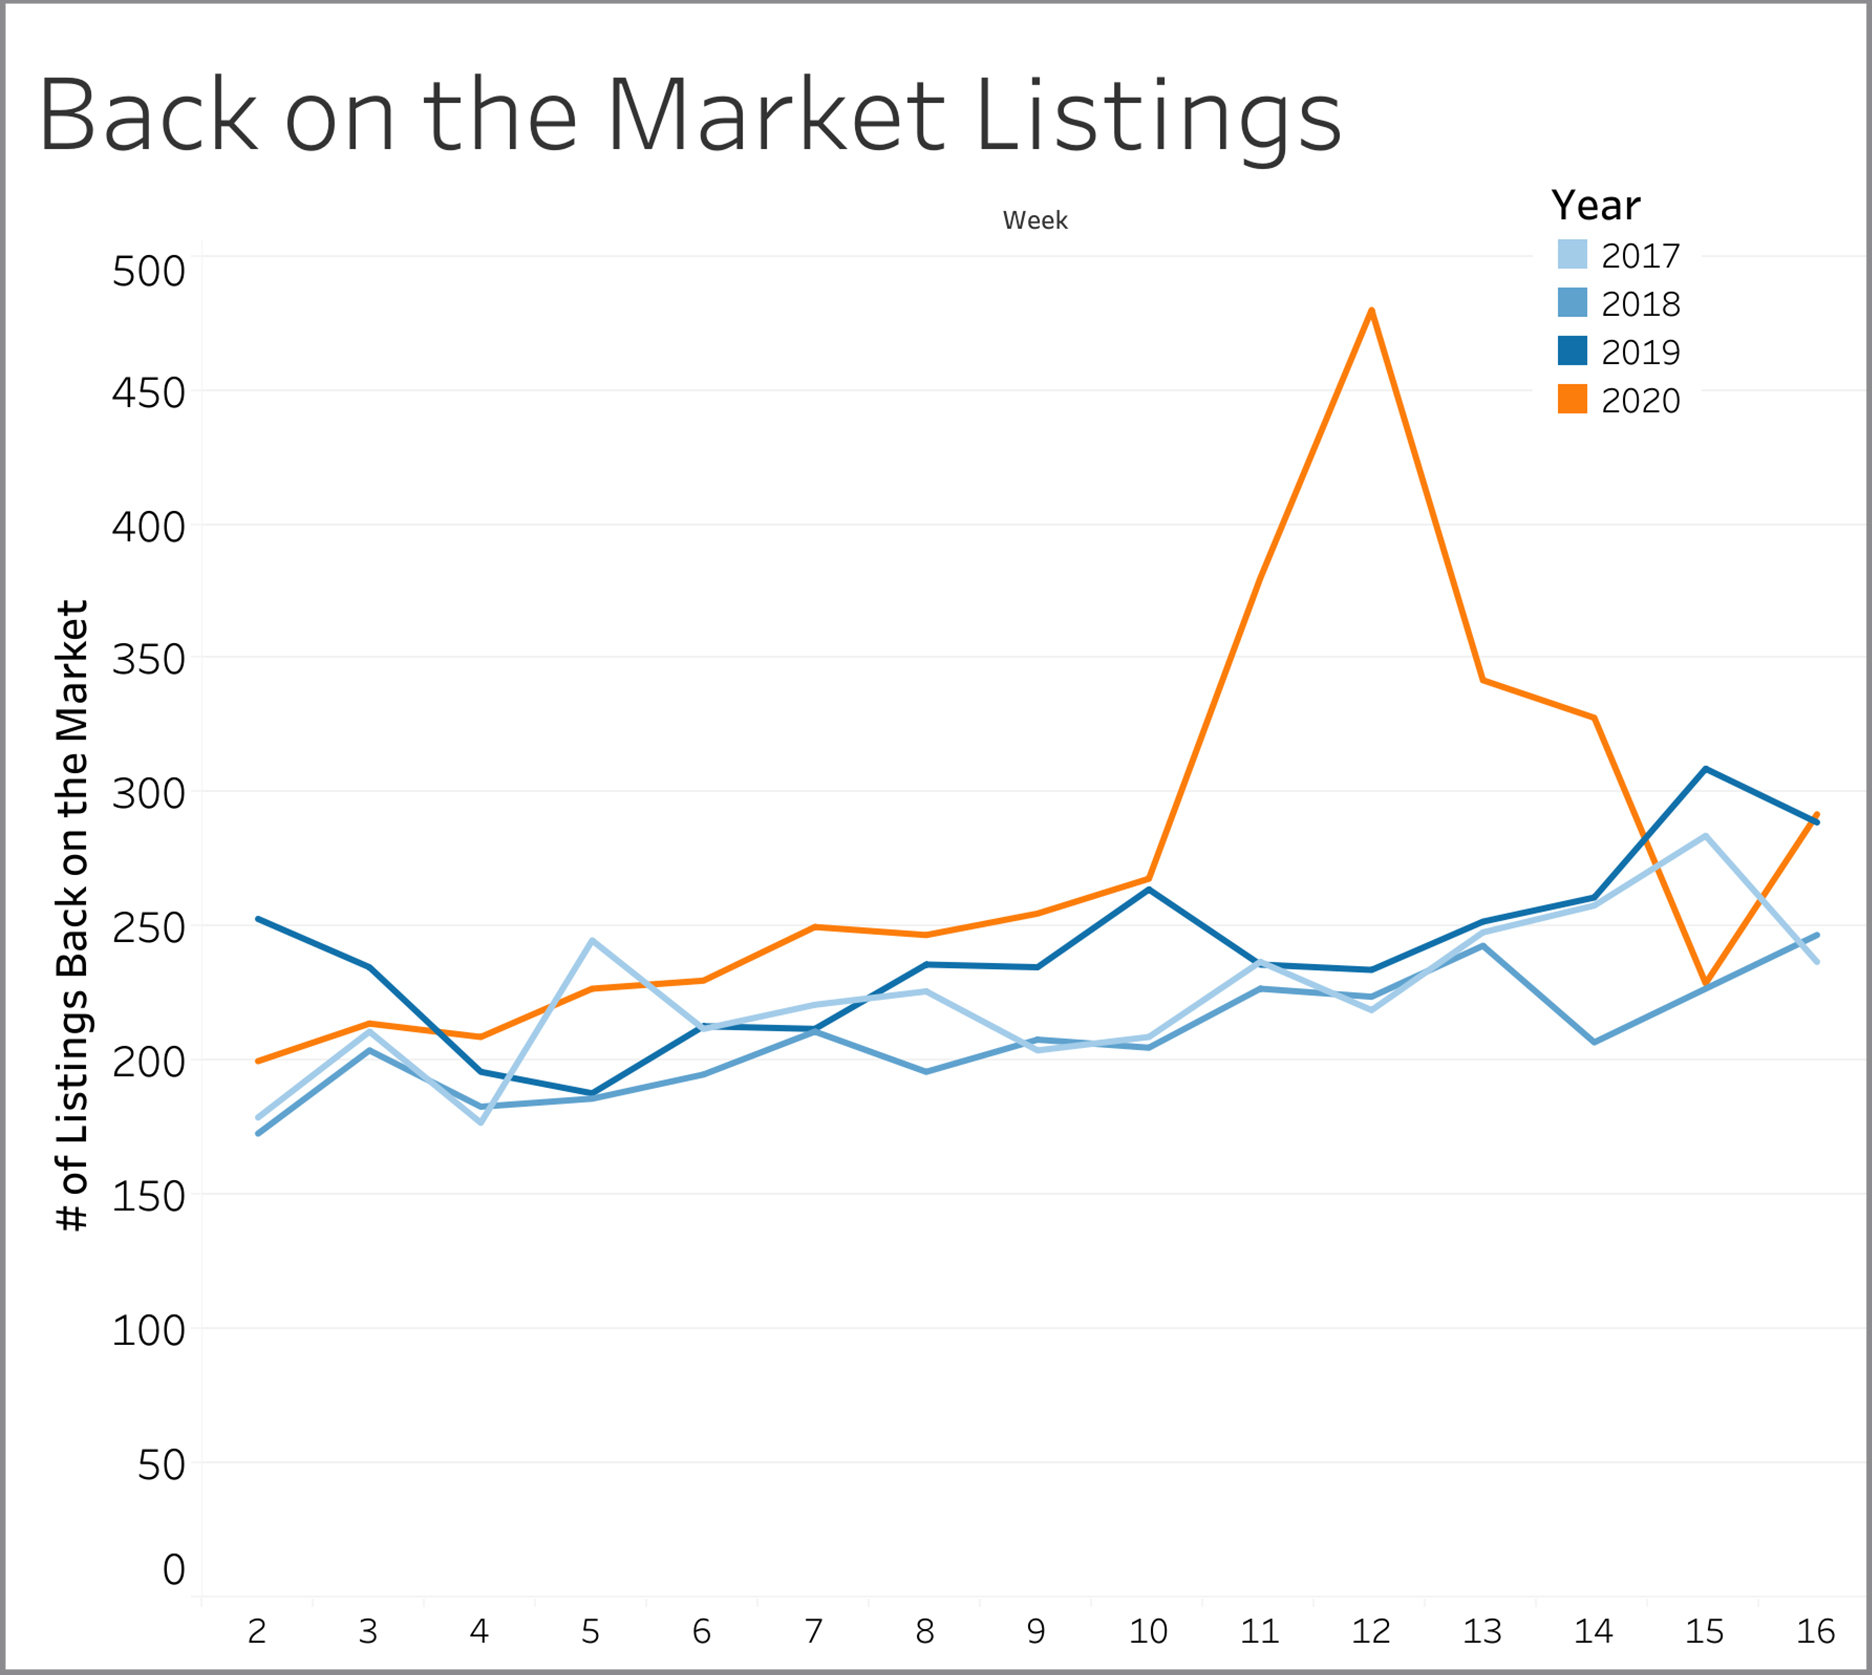
Listings Back on Market:
Listings back on the market is a measure of strength of sellers’ desire to sell since it tracks sellers that lost a deal with one buyer but have come back on the market for another try. After initially spiking, this metric is back to what is normal for this time of year.
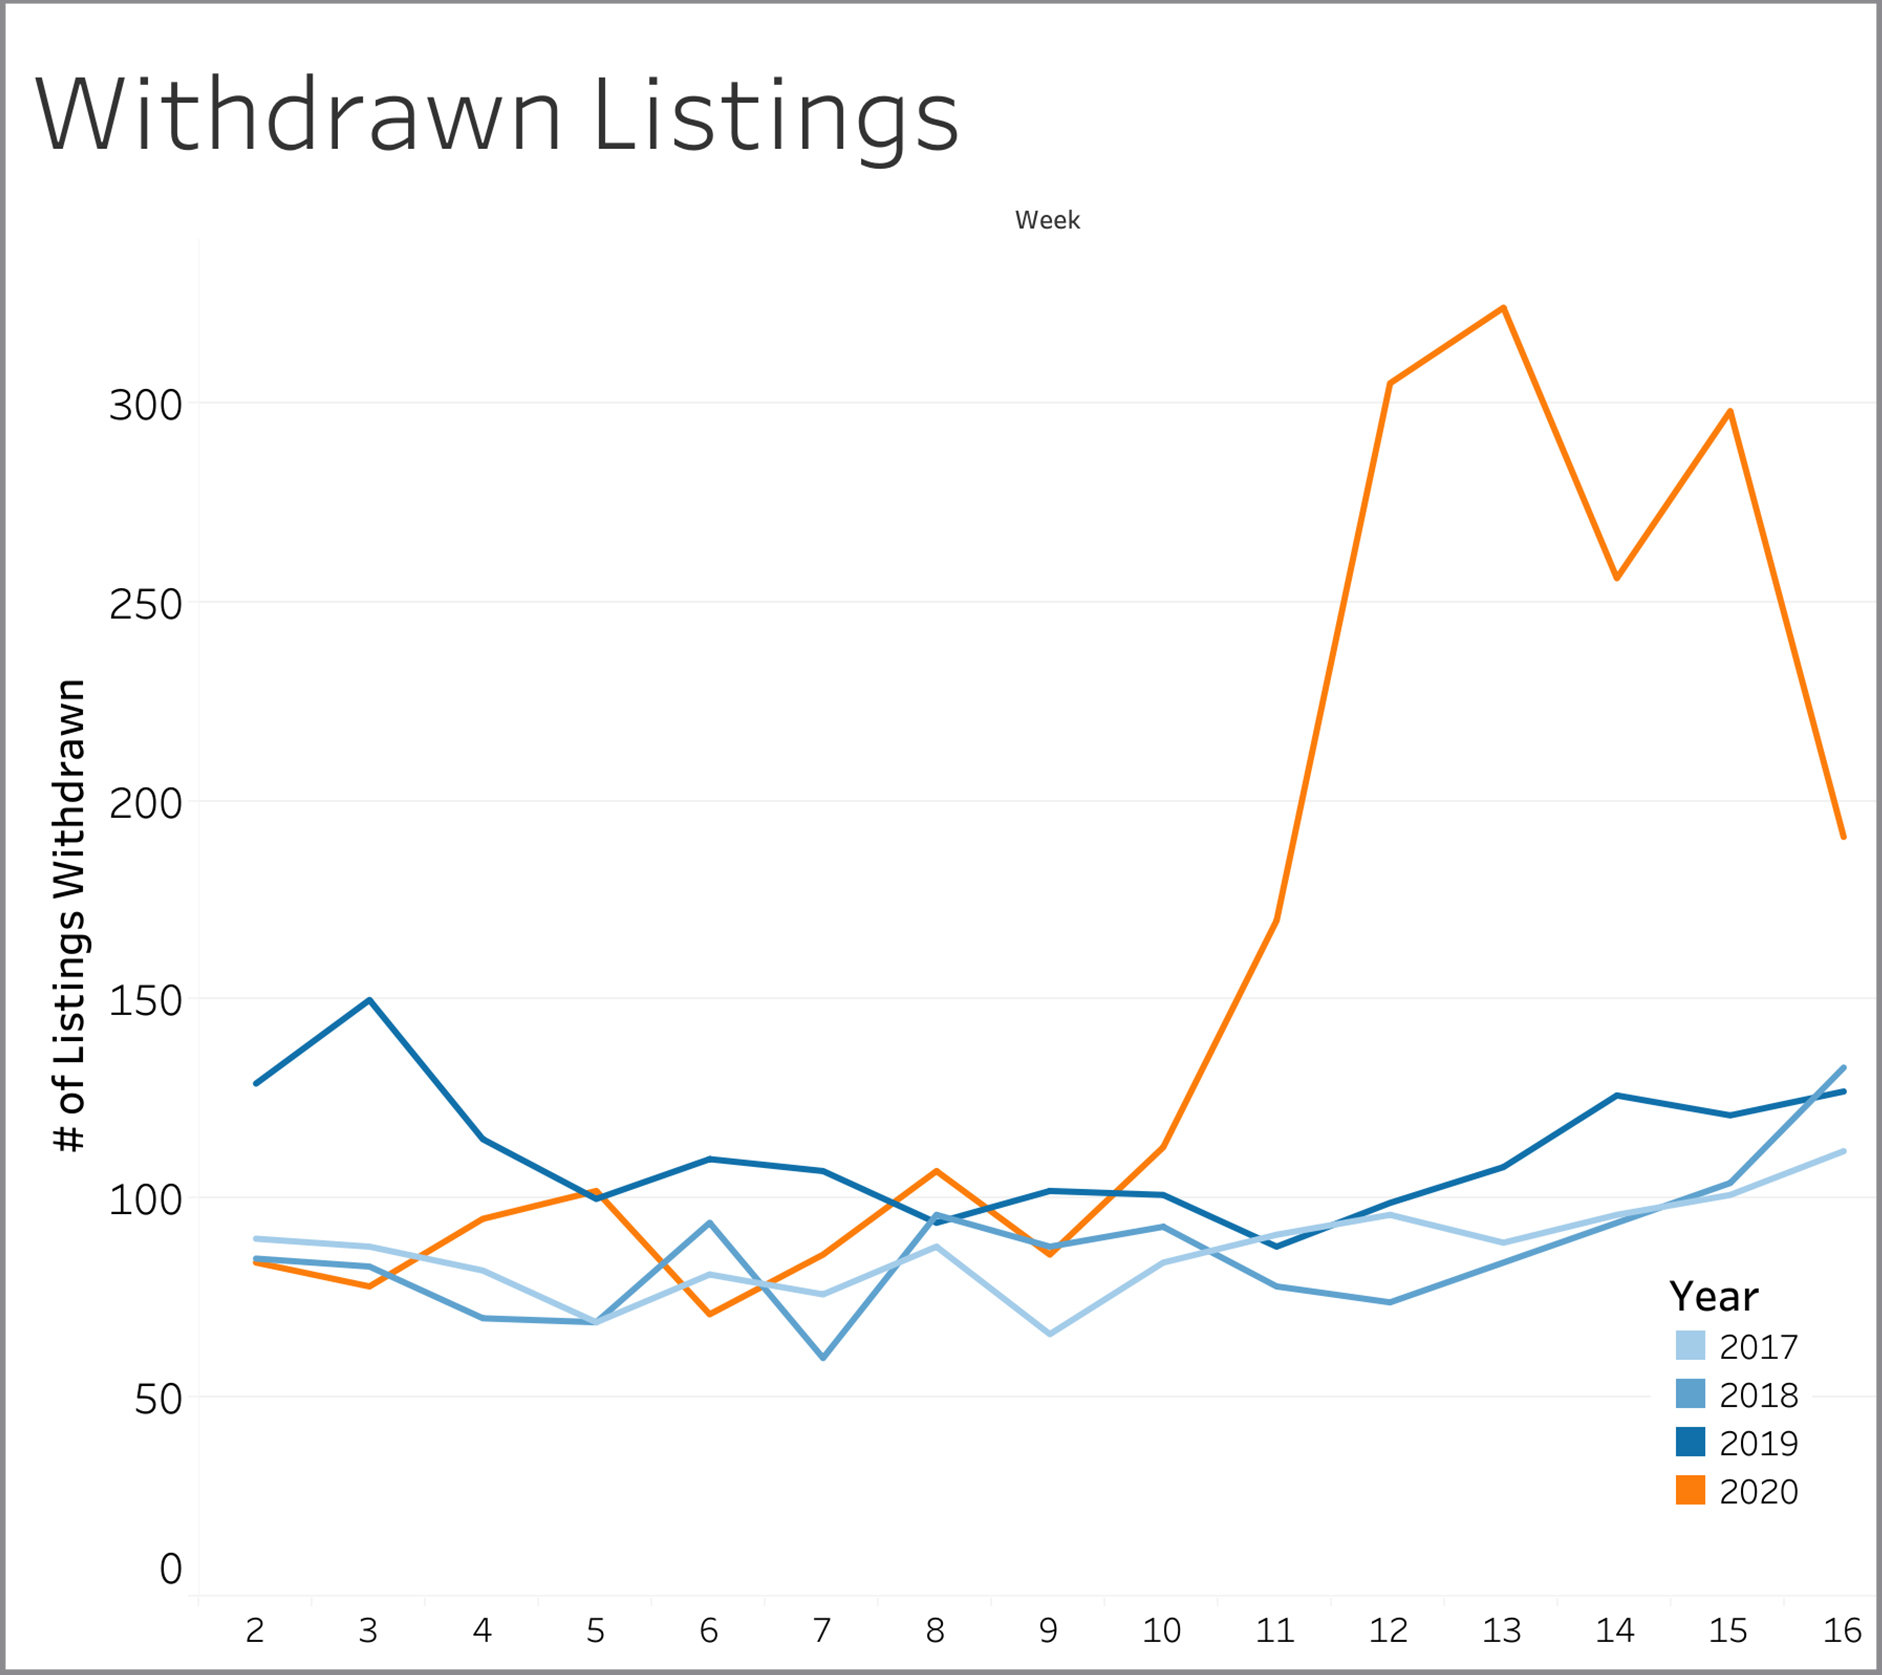
Withdrawn Listings:
Withdrawn listings are sellers that have either given up altogether on selling or that have temporarily halted showings. The last three weeks have shown a tendency for this measure of seller confidence to return to typical levels, although the number is still 50% above Week 16 of the three prior years.
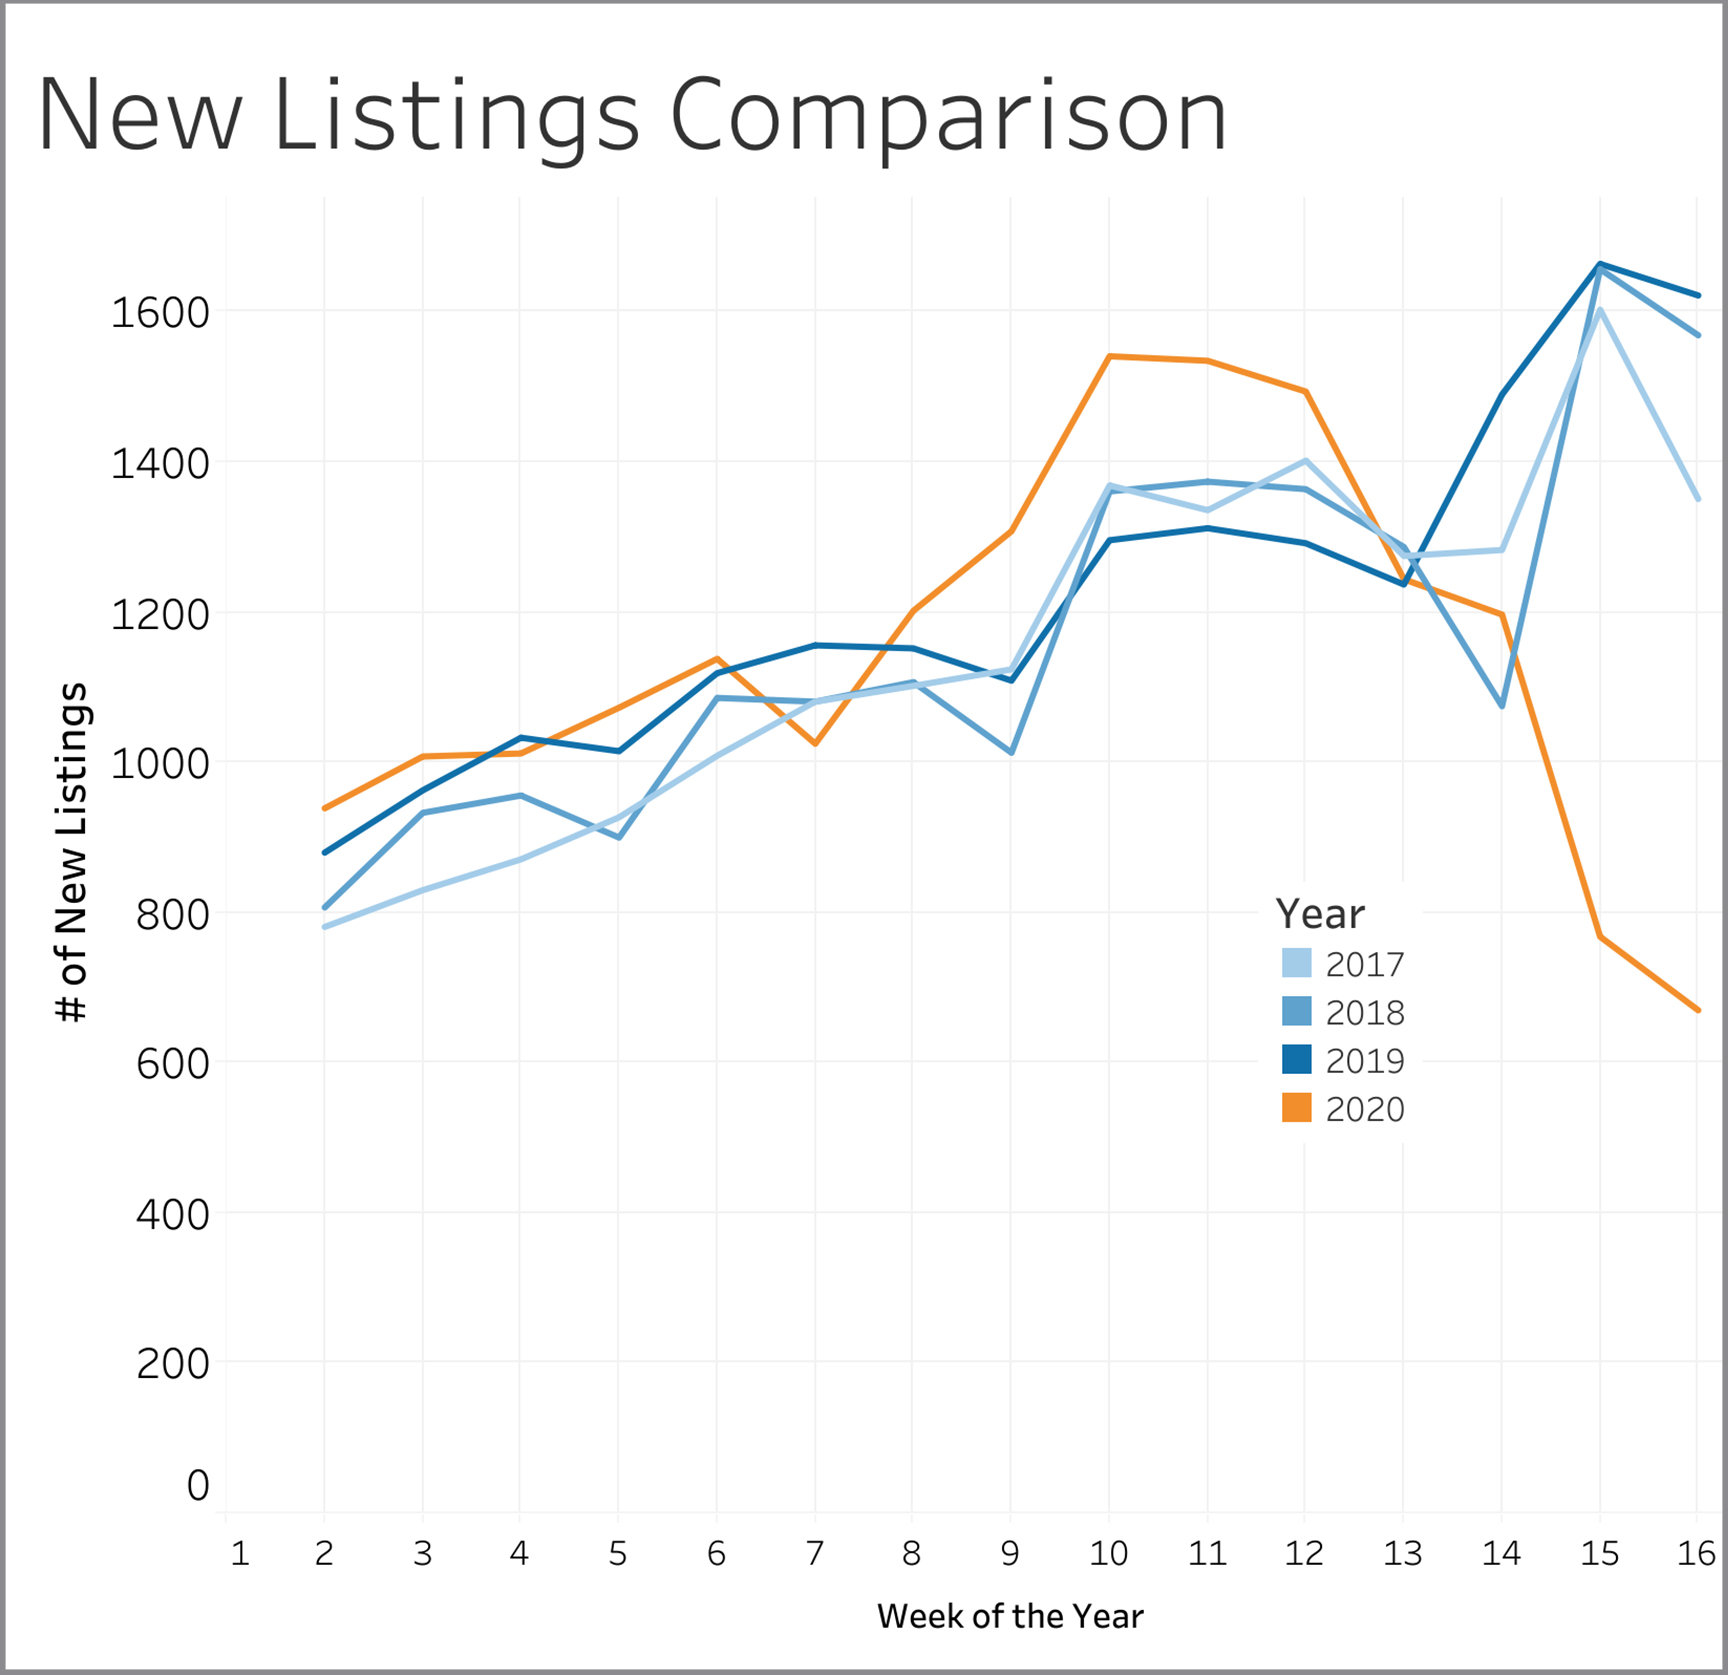
New Listings:
New listings indicate seller desire to sell and the confidence they have in getting the process started. The significant downturn that started last week has continued in Week 16 and is likely tied to rulings that no in-person showings would be allowed. In-person showings resume April 27th.
Sold Price versus Original List Price:
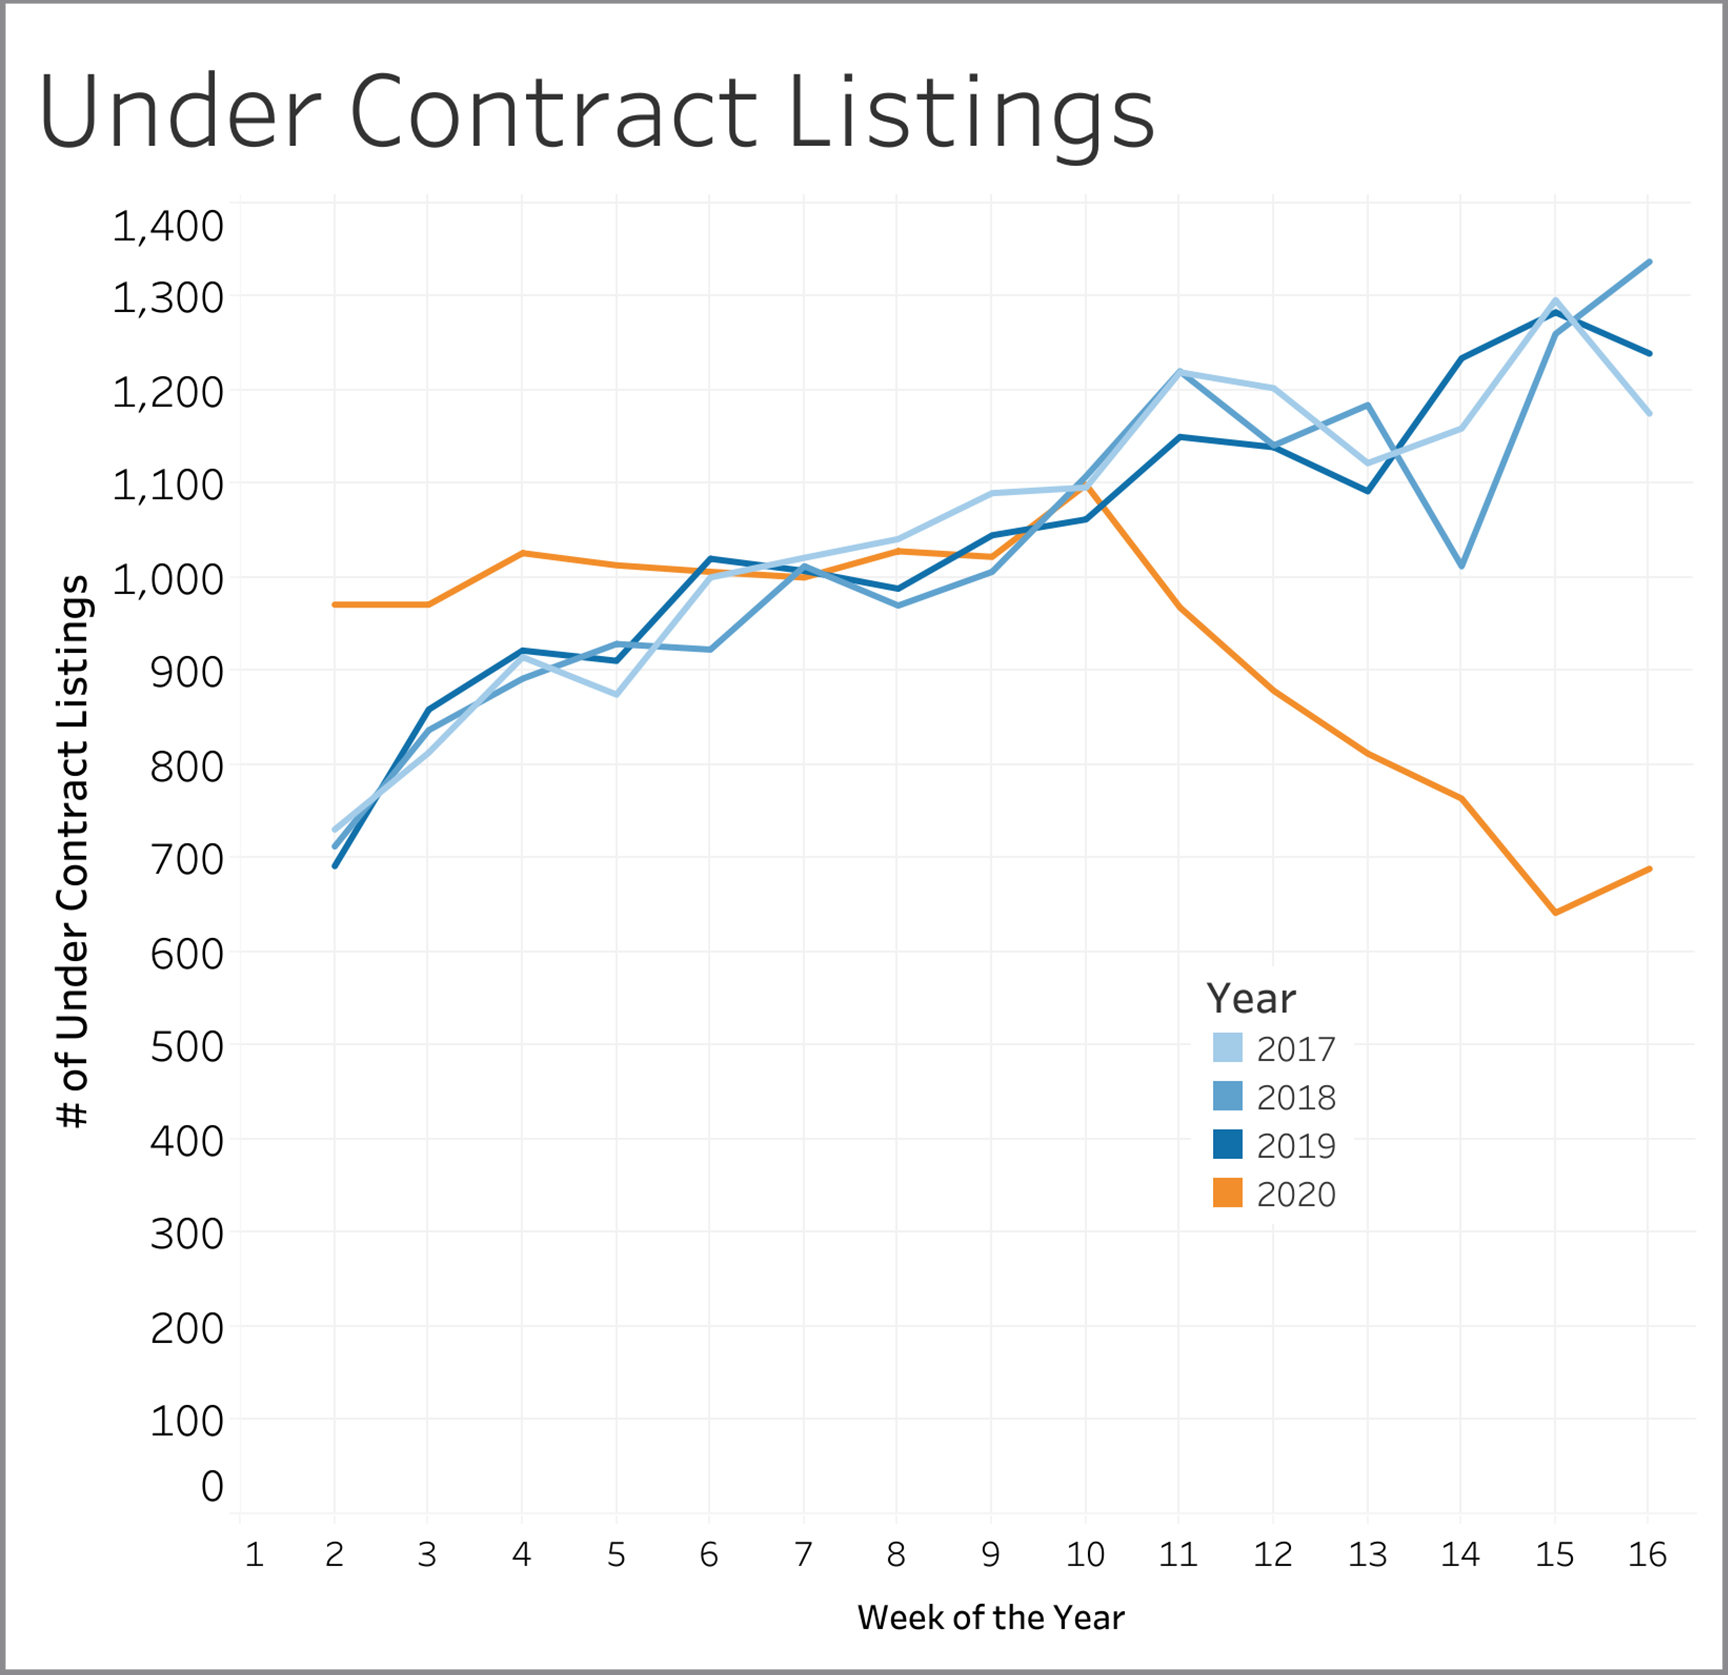
Under Contract Listings:
Properties going under contract show us whether buyers are confident to do business in the current market environment. We had 689 homes go under contract in Week 16, which is in line with the 670 new listings that hit the market. If sellers put their homes on the market, buyers are snatching them up.
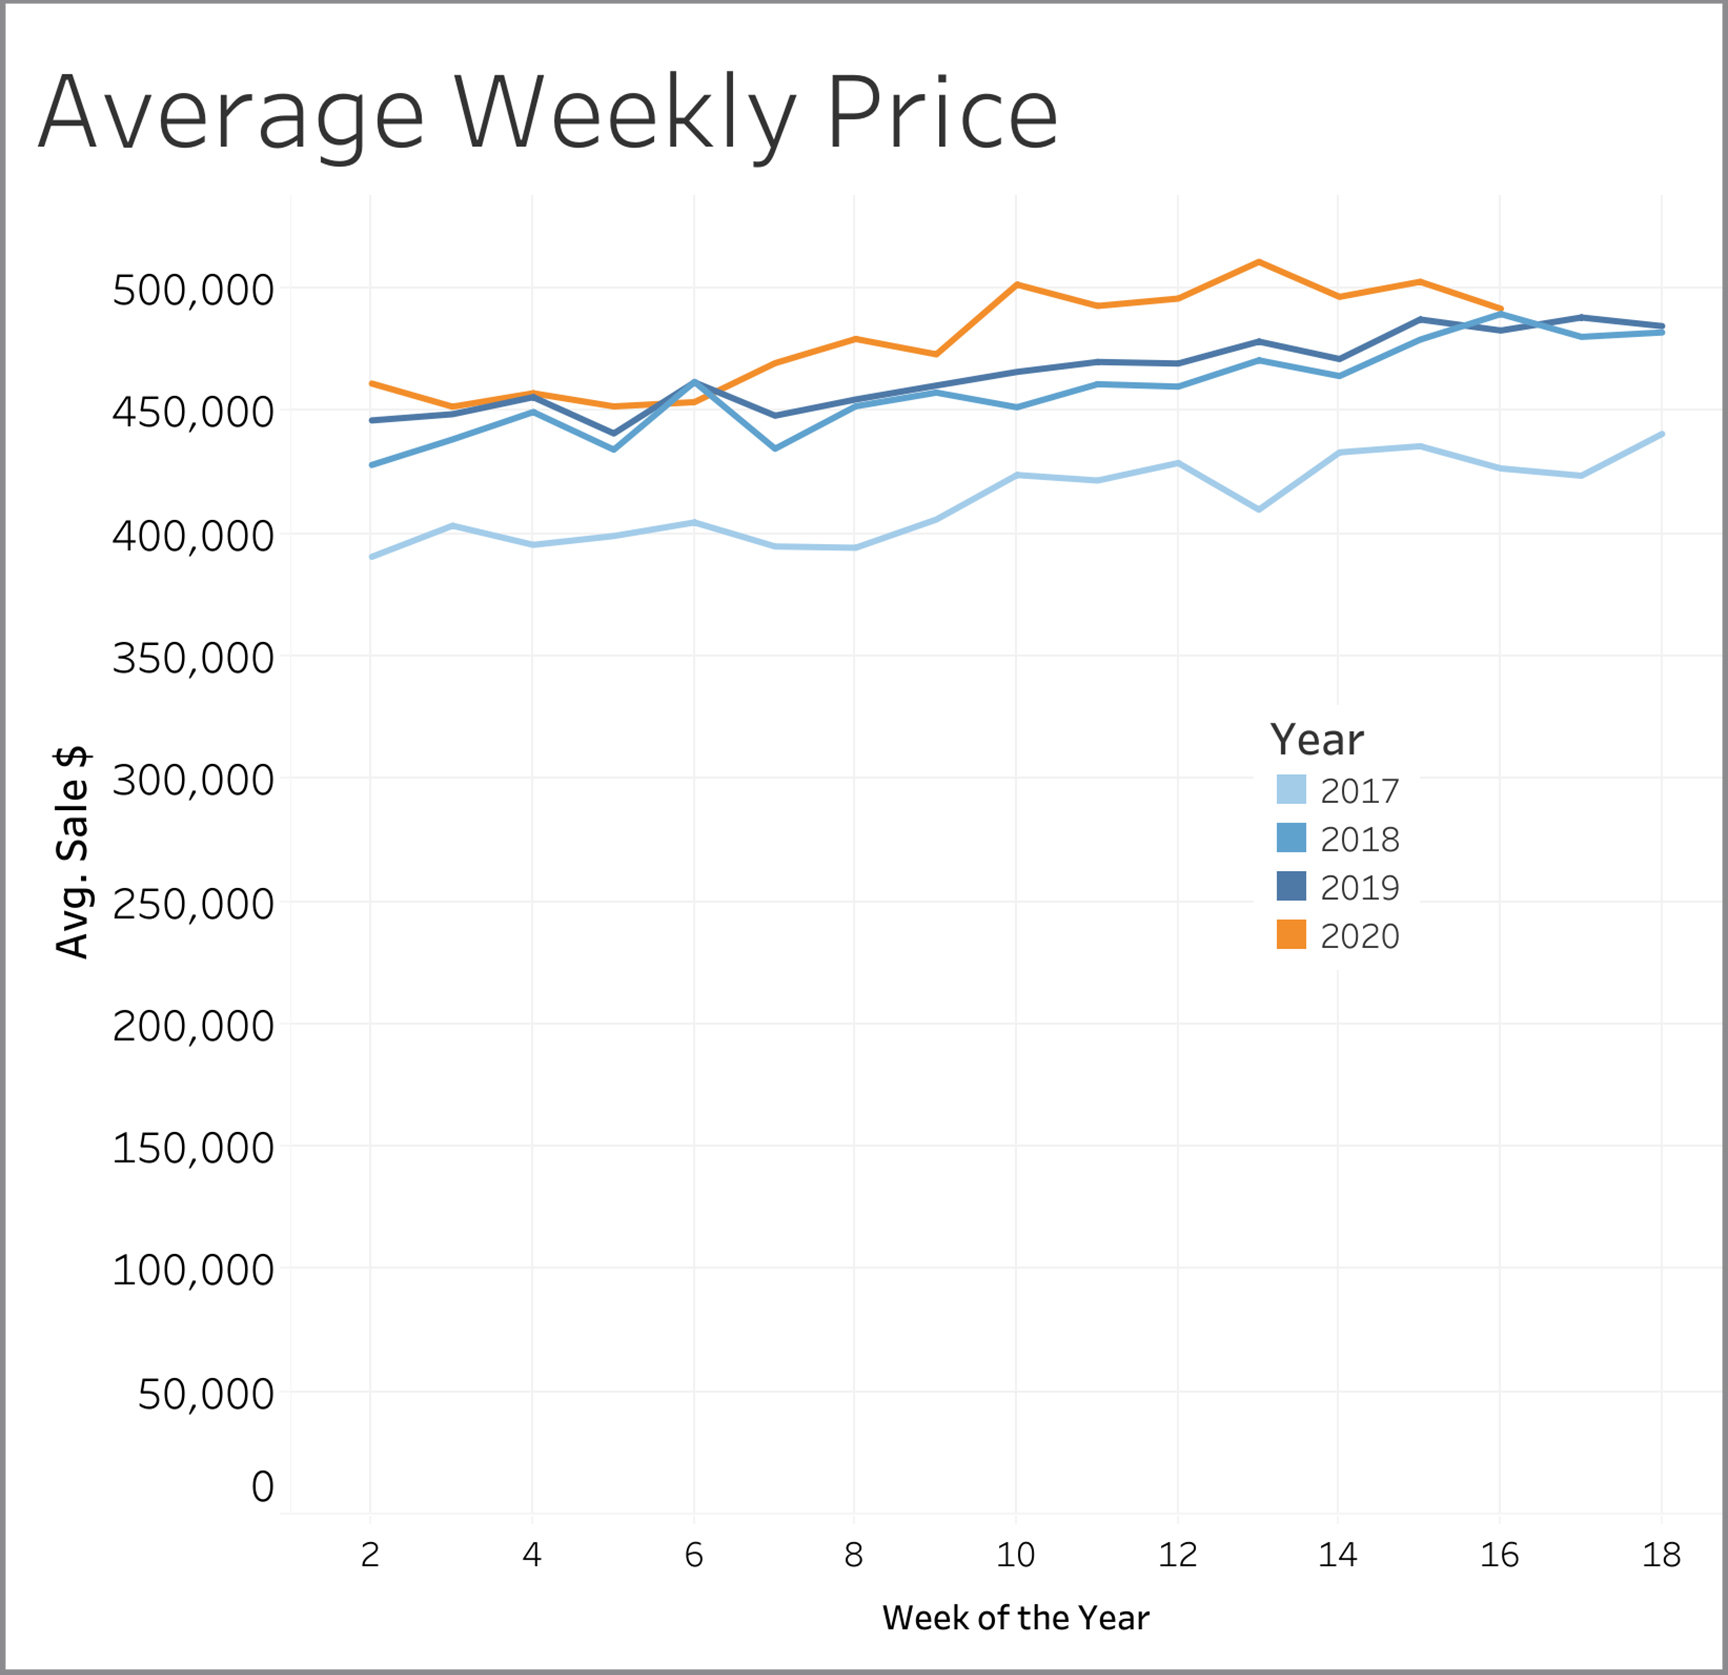
Average Price:
This average price by week is highly sensitive to the distribution of homes in various price ranges that happen to close during that week. This can be seen looking at the lines for 2018 and 2019. Prices were up overall in 2019 by 3.5% to 4.0% over 2018 and yet the average price in any given week of those years frequently crosses each other. The trend so far in 2020 is that prices are up about 6% compared to a year ago even though the Week 16 average price is very close to the average price of prior years.
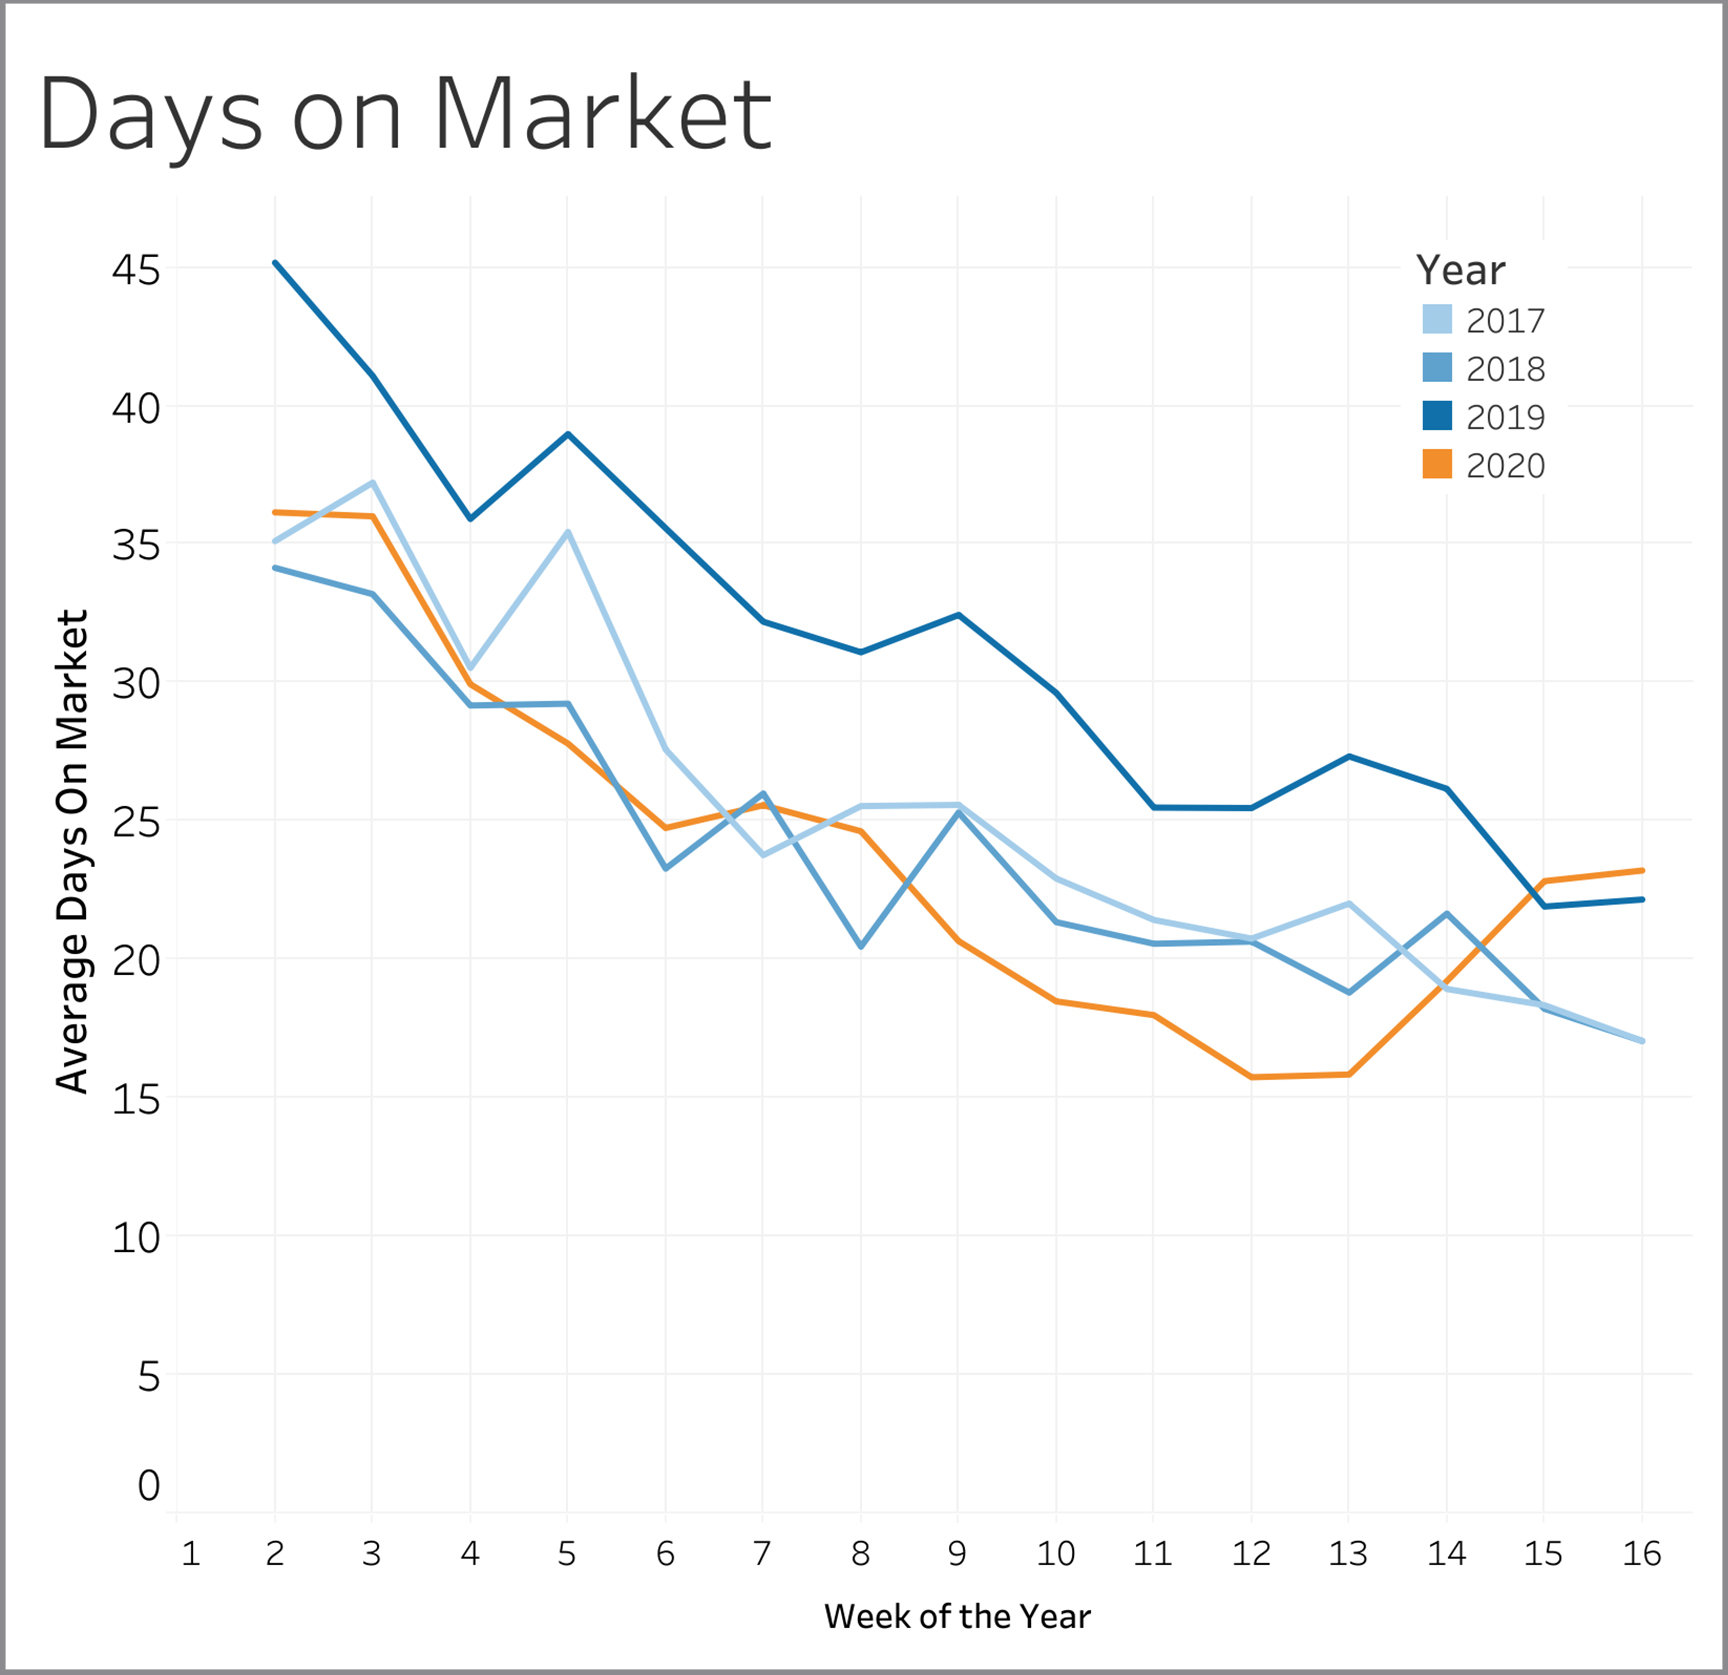
Days on Market:
This is the time from when a property first comes on the market to when it goes under contract. After being consistently below prior year levels in Weeks 9 through 13, we are now slightly above 2017 through 2019. Nevertheless, the actual number of days it takes to get a property under contract remains quite low.
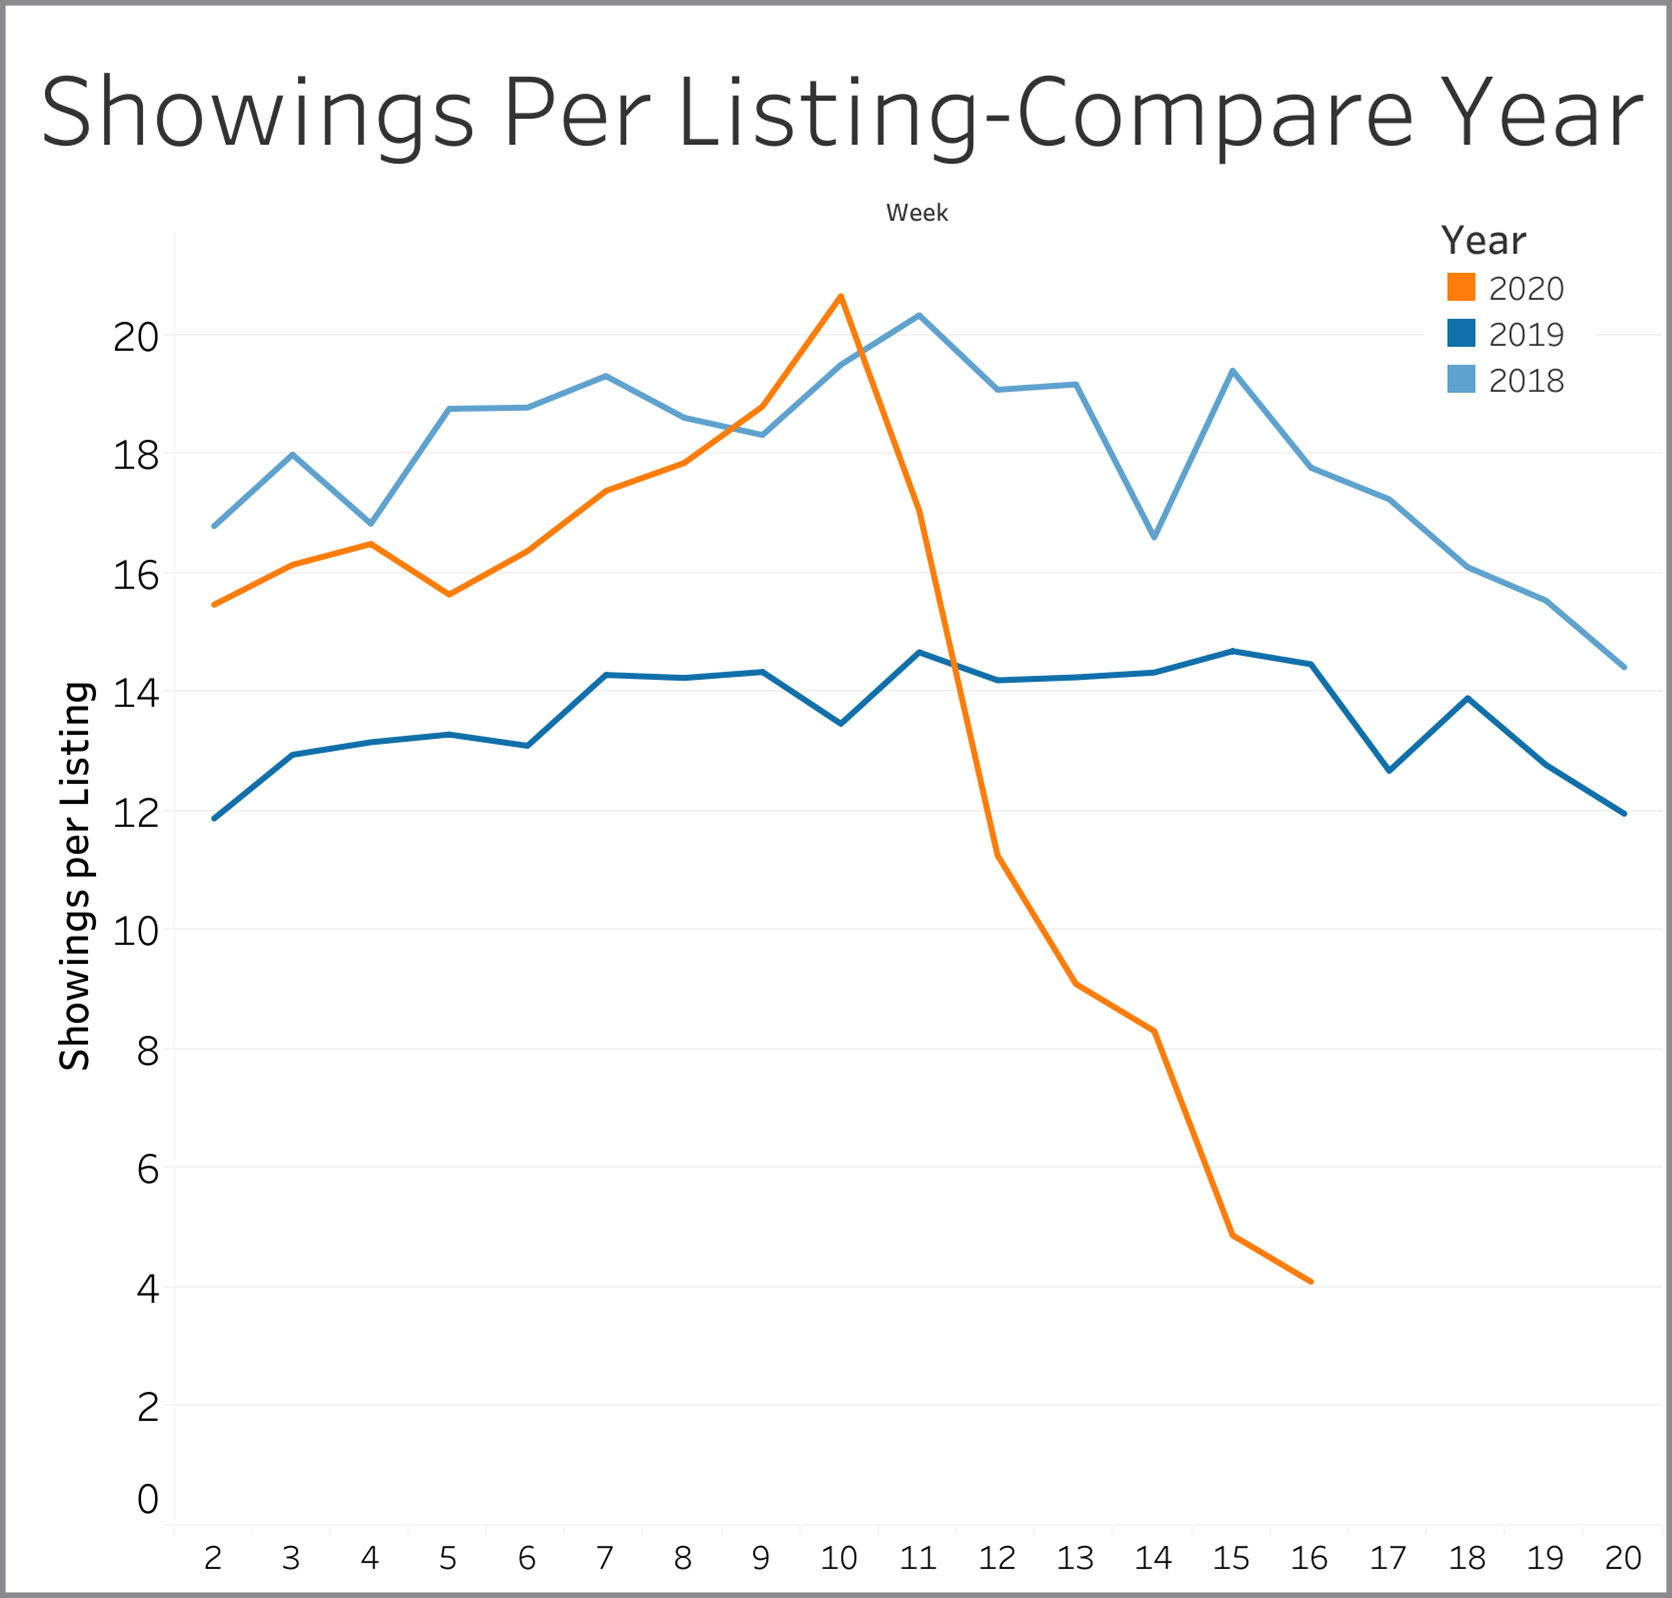
Showings per Listing:
We’ve seen this metric decline pretty consistently since Week 10, but it took a more pronounced downturn in Week 15. Confusion and outright bans on in person showings have created far fewer showings. Virtual showings have become more common and are not reflected in the numbers shown here.
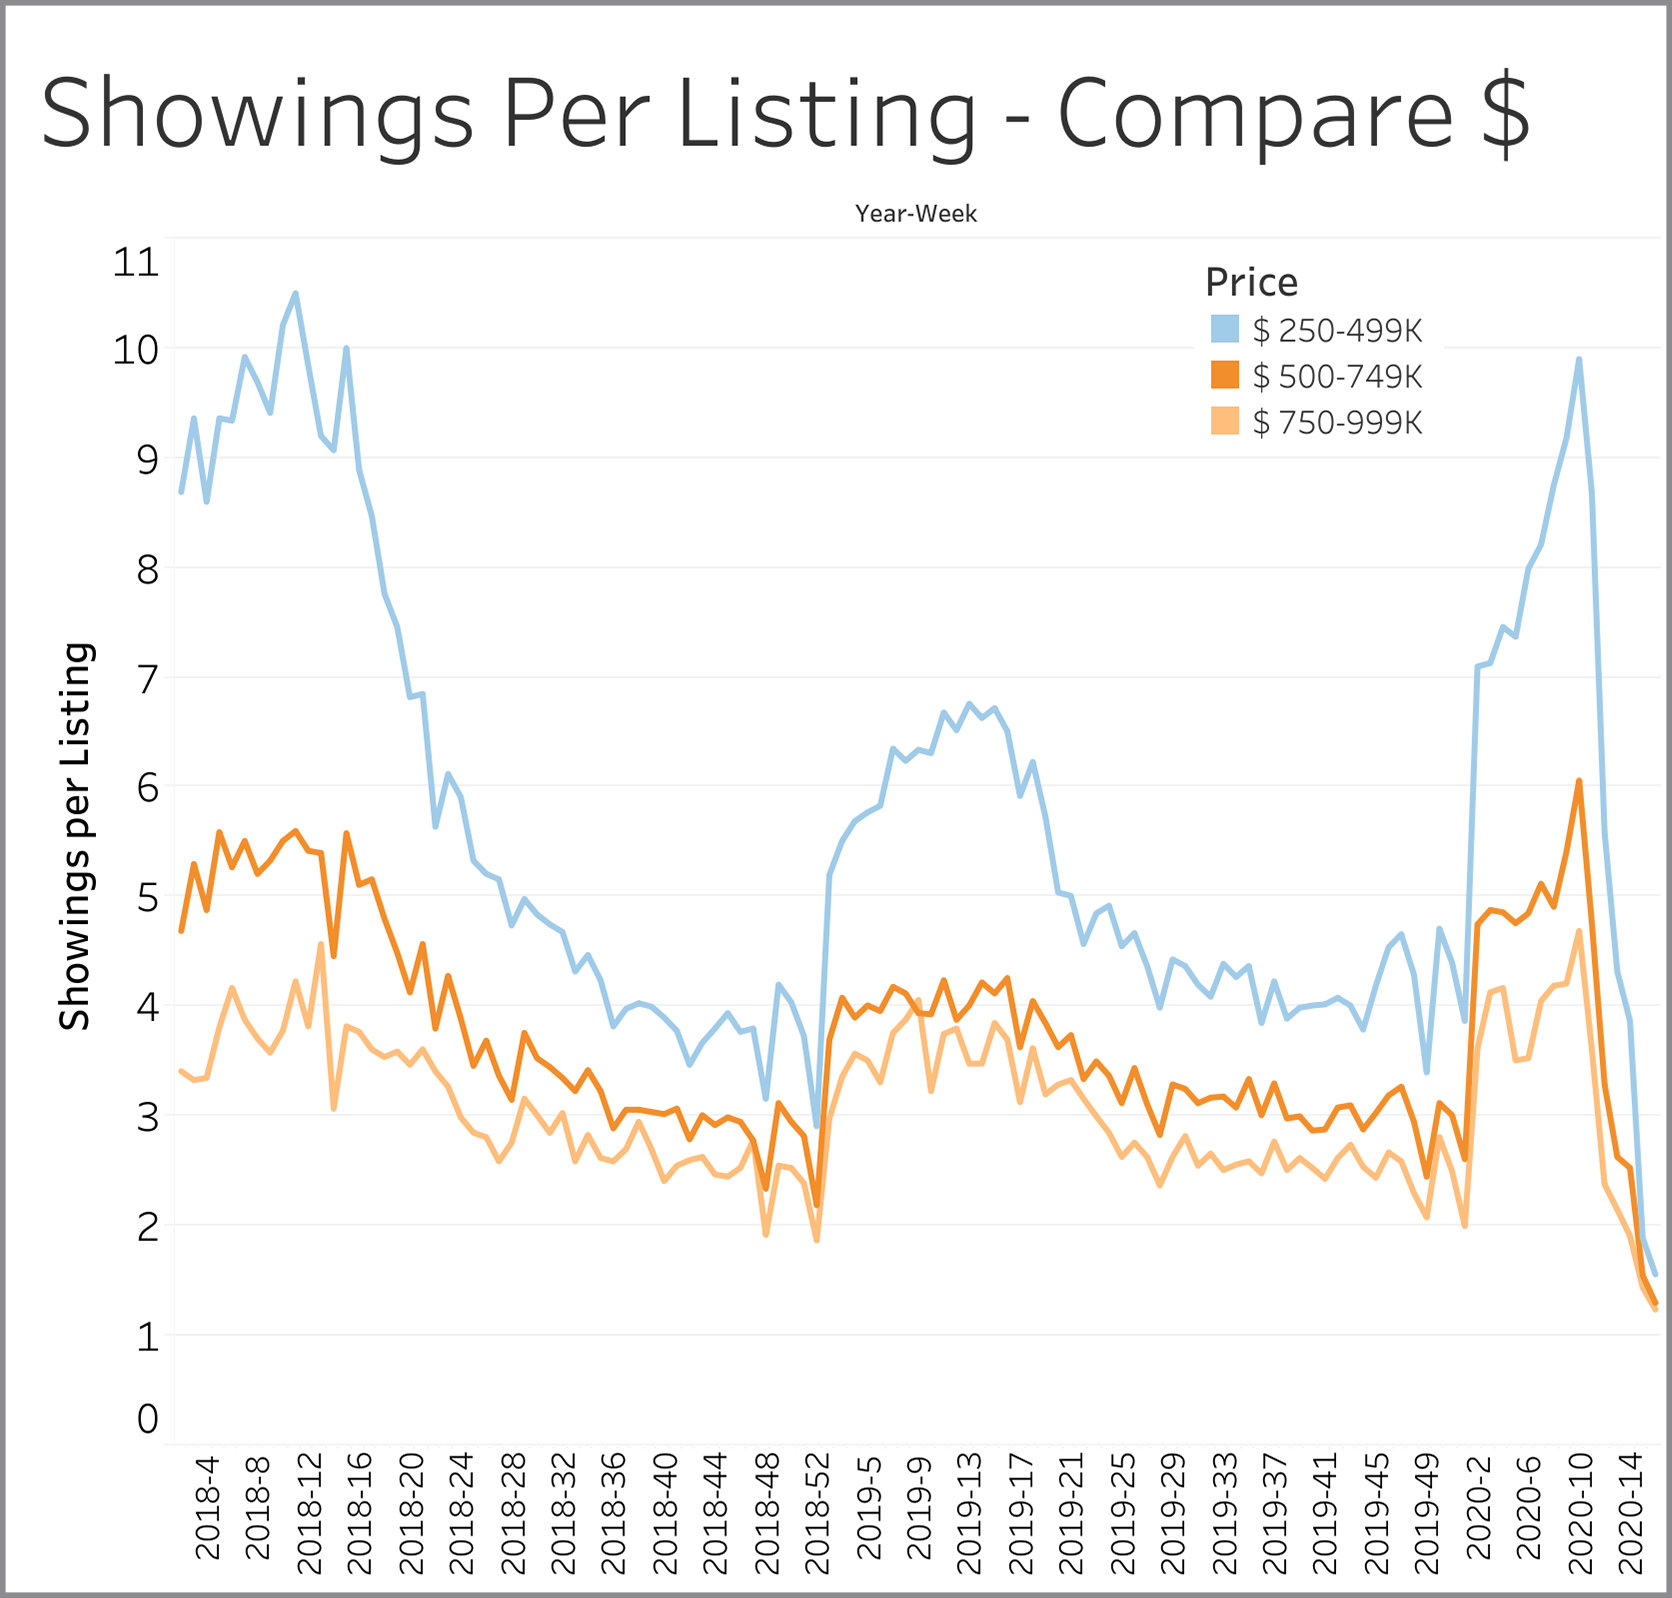
Showing per Listing by Price Range ... $250k to $1M:
Showings per listing are down across all price ranges below $1,000,000 but see the information on showings required to get a contract for a more complete picture.
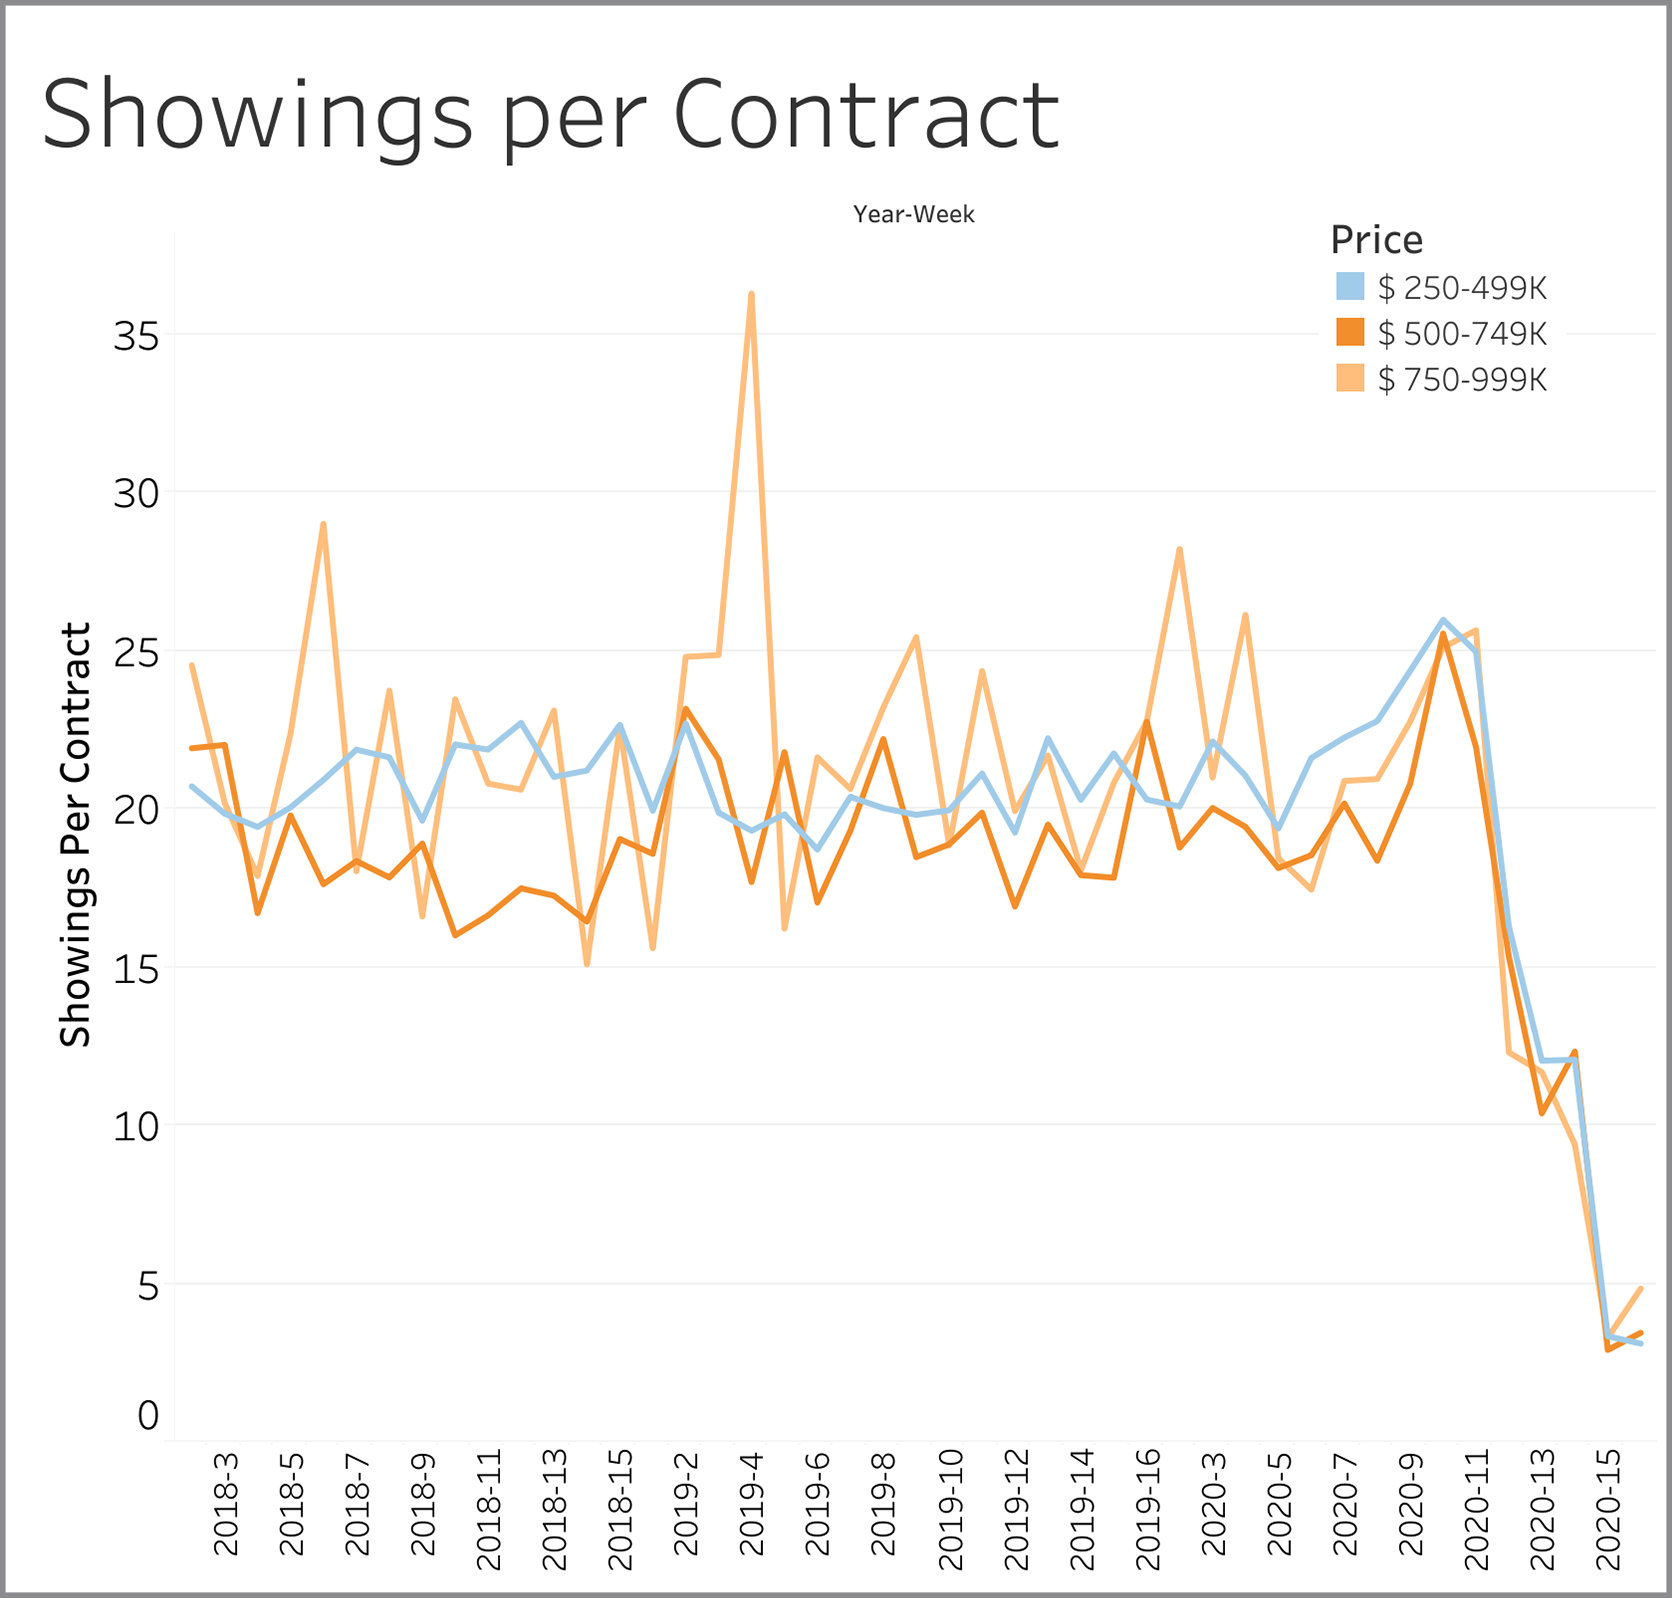
Showings Needed for Contract - $250k to $1M
While showings per listing are down anywhere from 50% to 80% since Week 10 as discussed previously, the number of showings it takes to get under contract are down by 85% compared to Week 10 levels. It was taking 24 to 26 showings six weeks ago to get a contract and now it is taking only four.