CHR WEEKLY
Findings Through Week 13, 2020
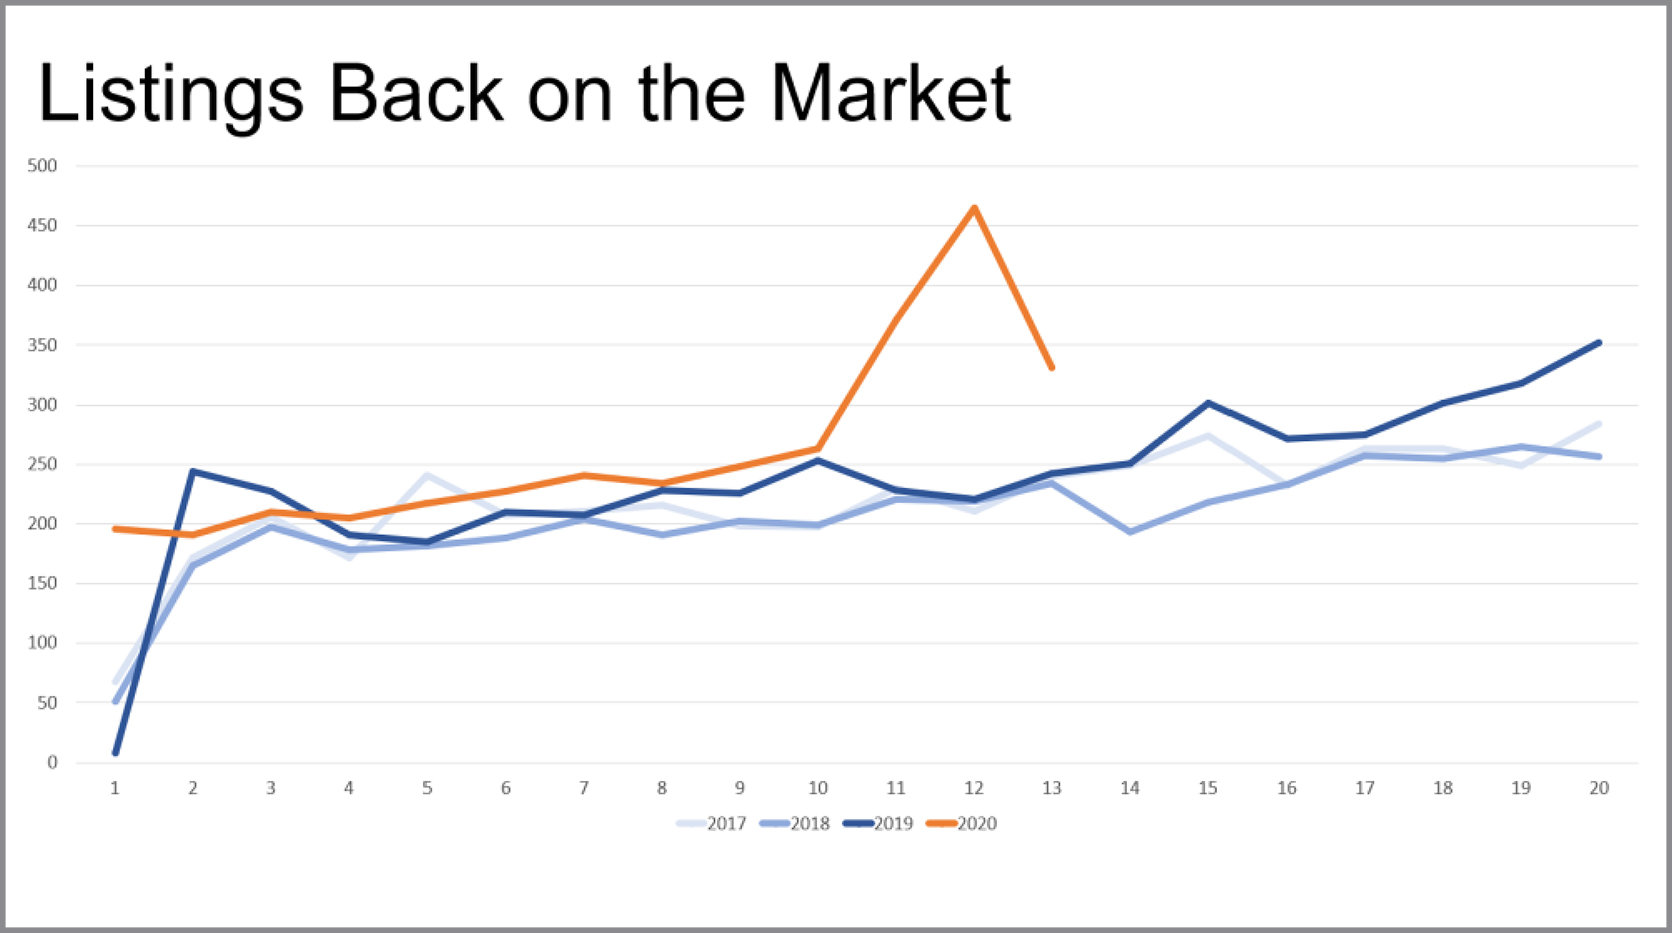
Listings Back on Market:
After closely following trends in the three prior years, listings coming back on the market after falling out of contract took a spike up in Weeks 11 and 12 this year but are now returning in Week 13 to levels normally experienced.
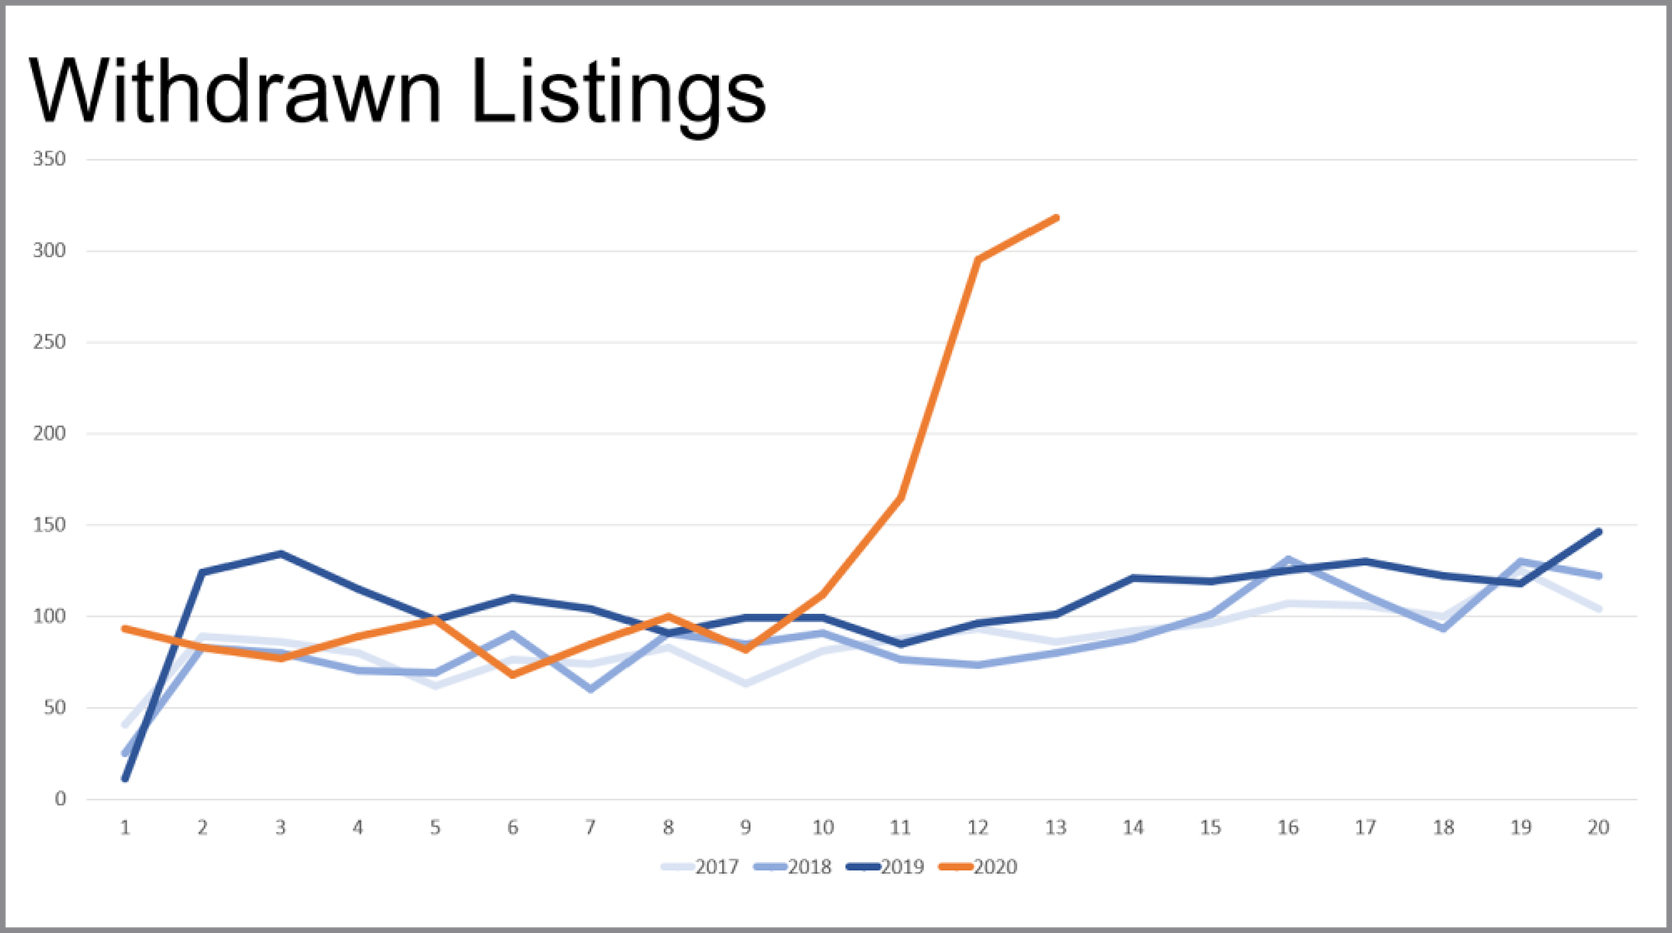
Withdrawn Listings:
These numbers jumped up significantly in Weeks 11 and 12 and are now leveling off but staying at historically high levels.
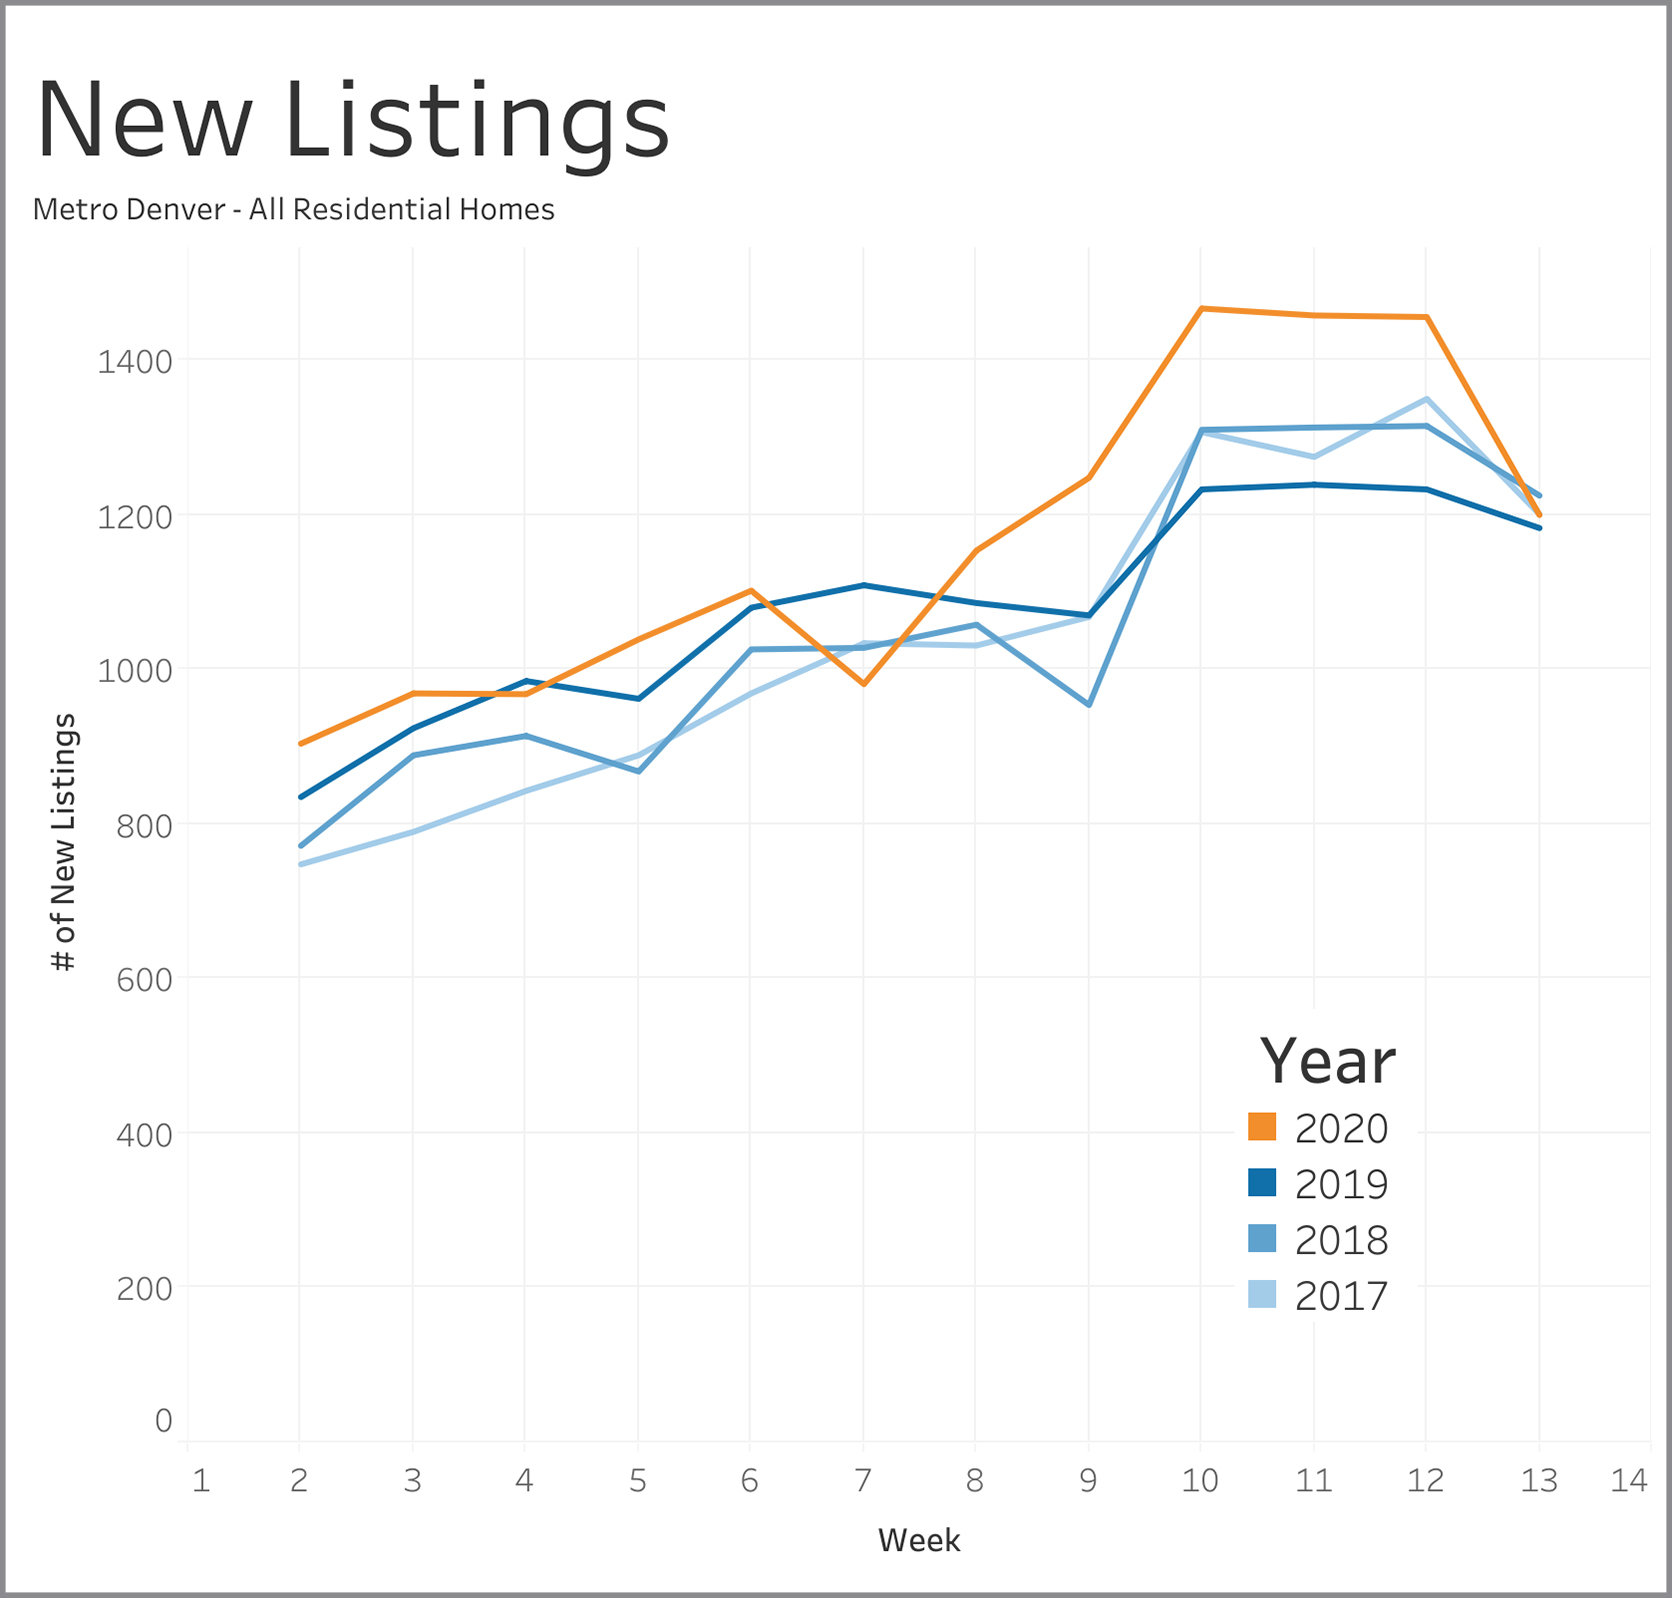
New Listings:
Properties coming on to the market the last few weeks are following a similar pattern to prior years - rising through Week 10, then leveling off and taking a slight downward move in Week 13.
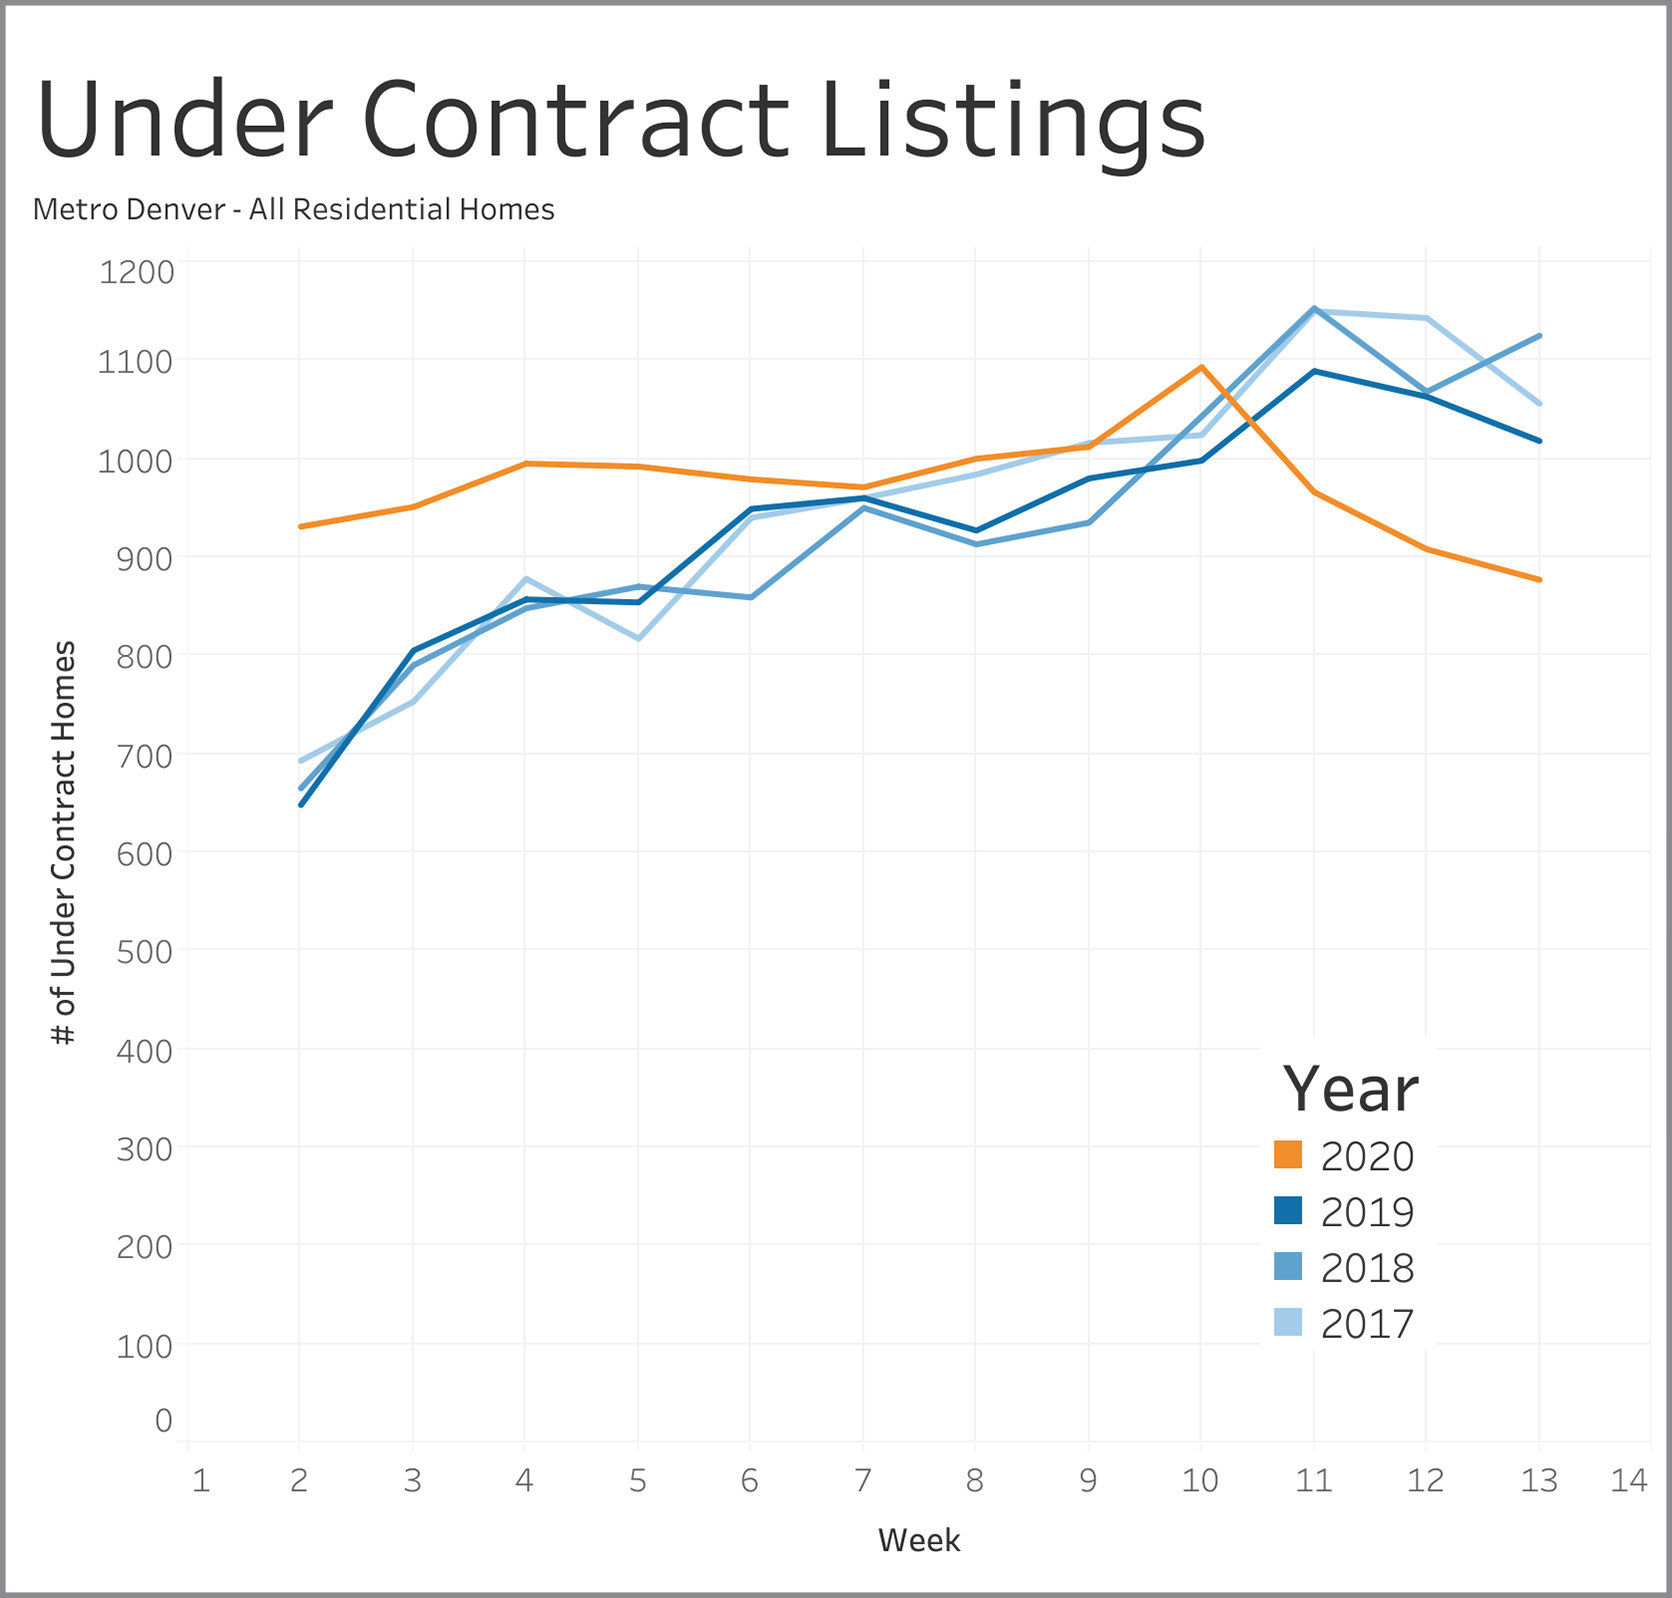
Under Contract Listings:
The number for properties going under contract each week were closing tracking prior year levels until Week 10 and now show a pronounced change in direction from prior years for Weeks 11 through 13. The numbers for Week 13 were about 900 versus 1050 to 1150 for the same week over the three prior years.
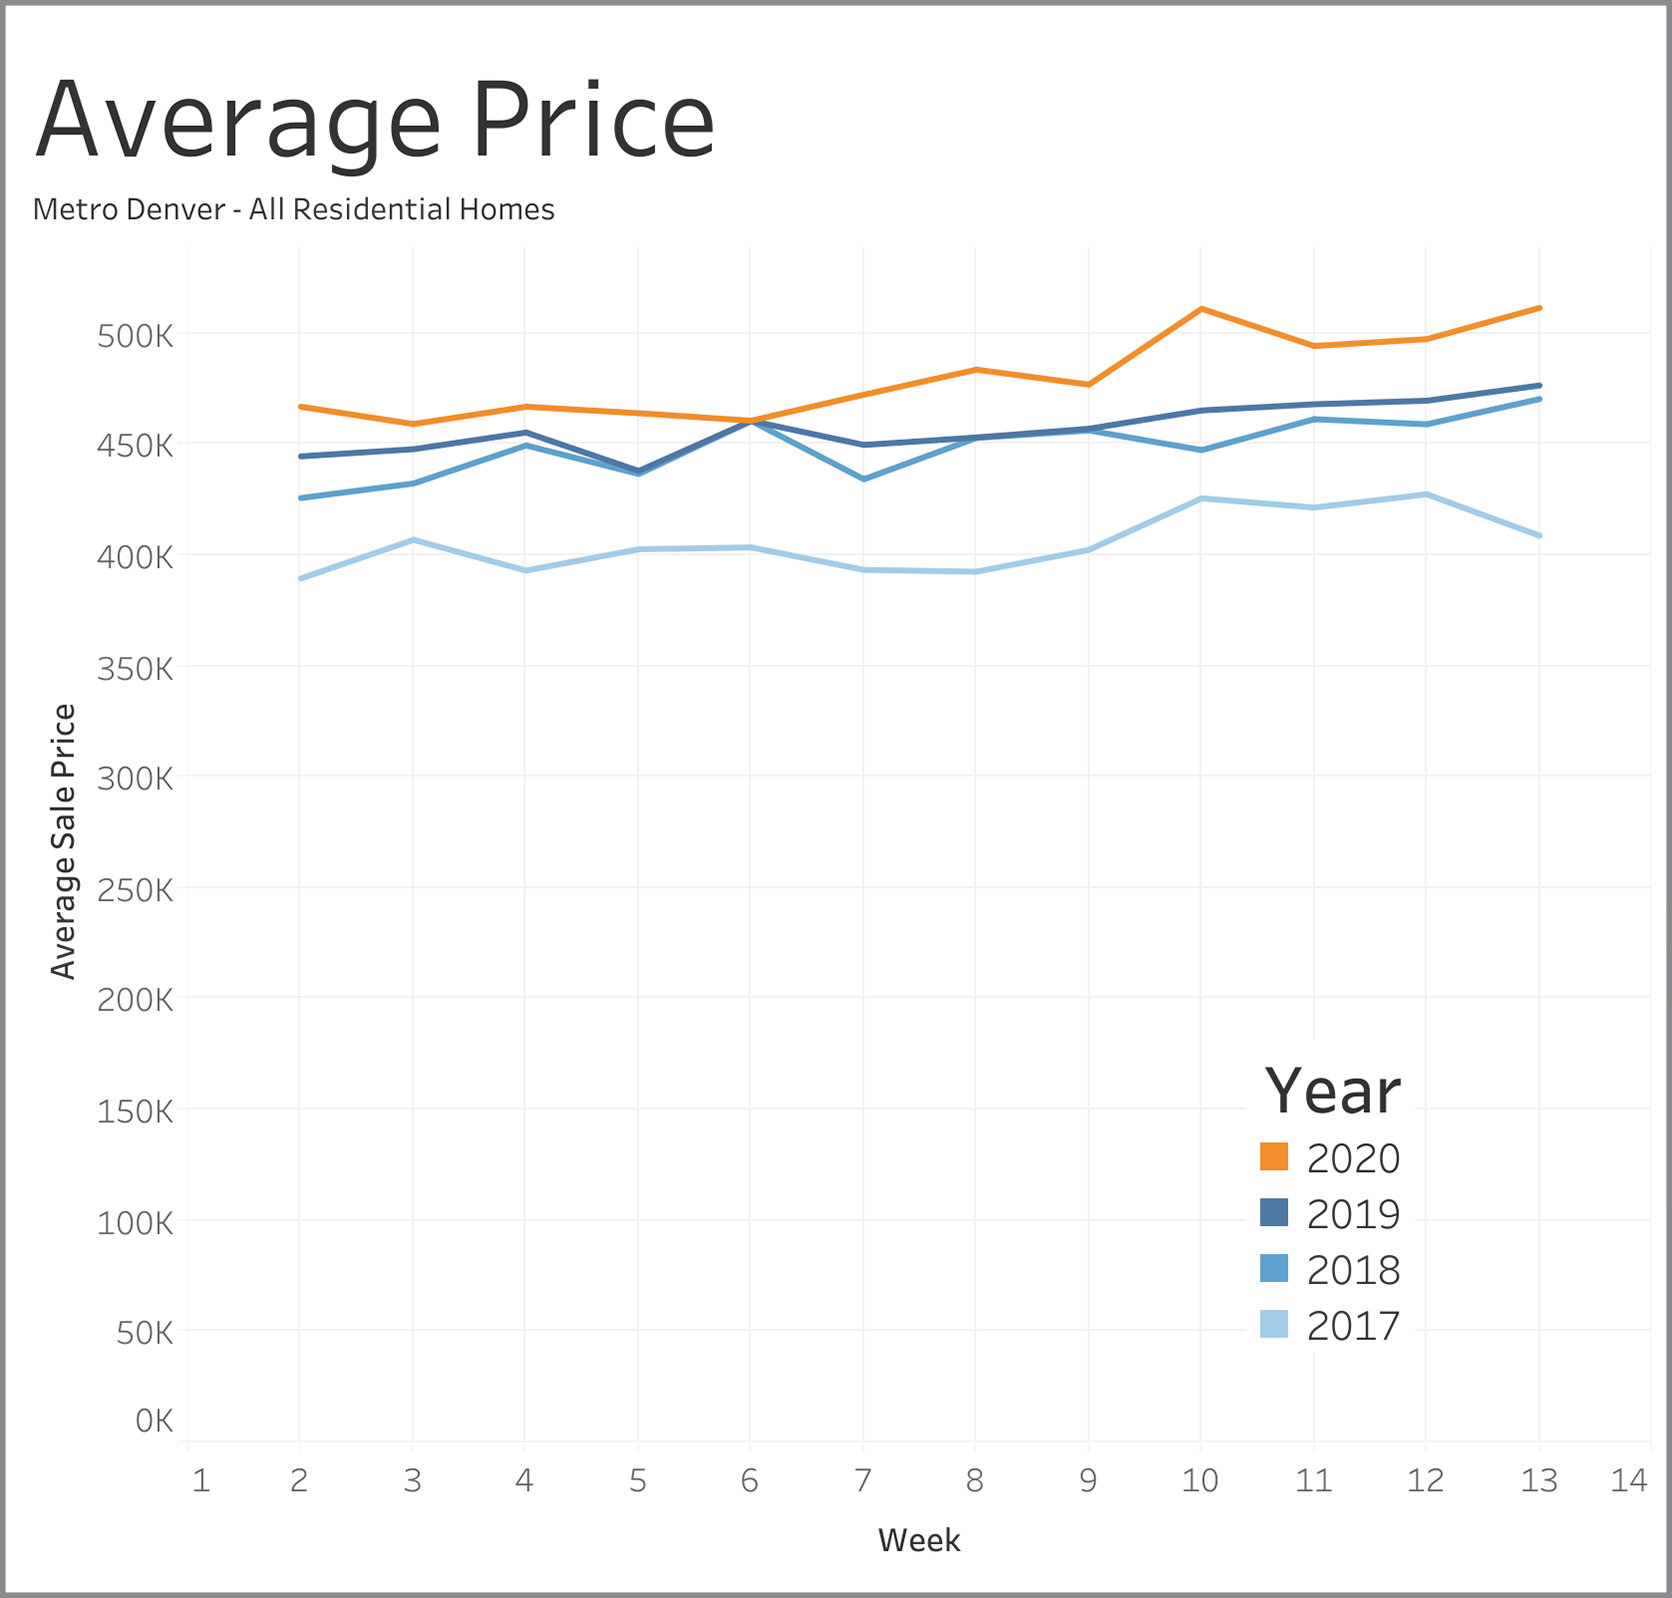
Average Price:
Average price each week is up consistently this year over last year and is following a similar pattern to prior years.
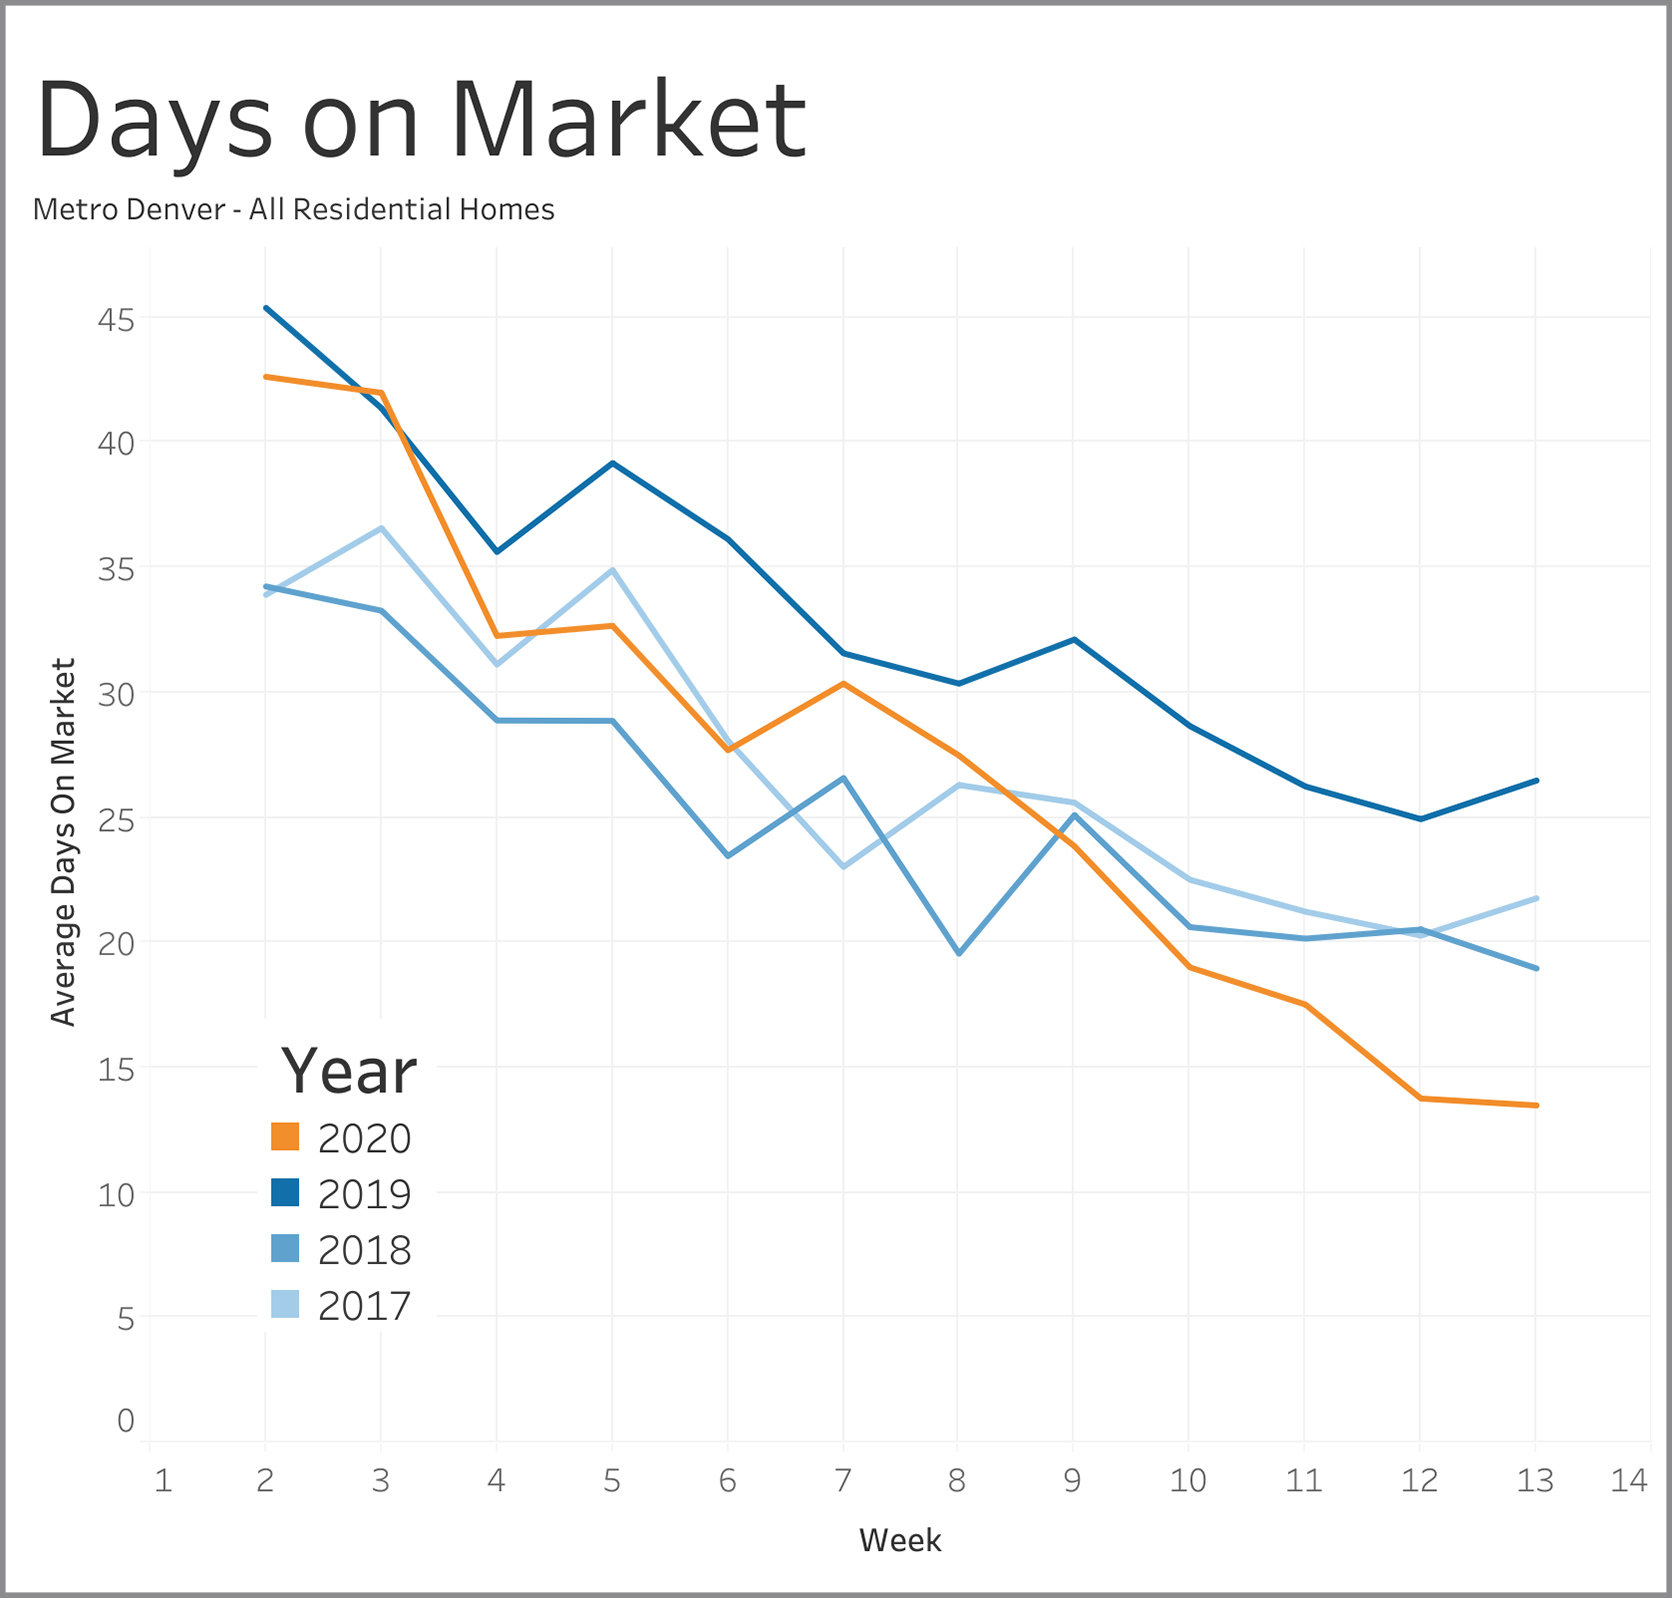
Days on Market:
Homes have been going under contract faster this year versus prior years for the last few weeks. The value was unchanged from a week ago, at around 14 days from hitting the market until under contract. The leveling off was consistent with the pattern of prior years.
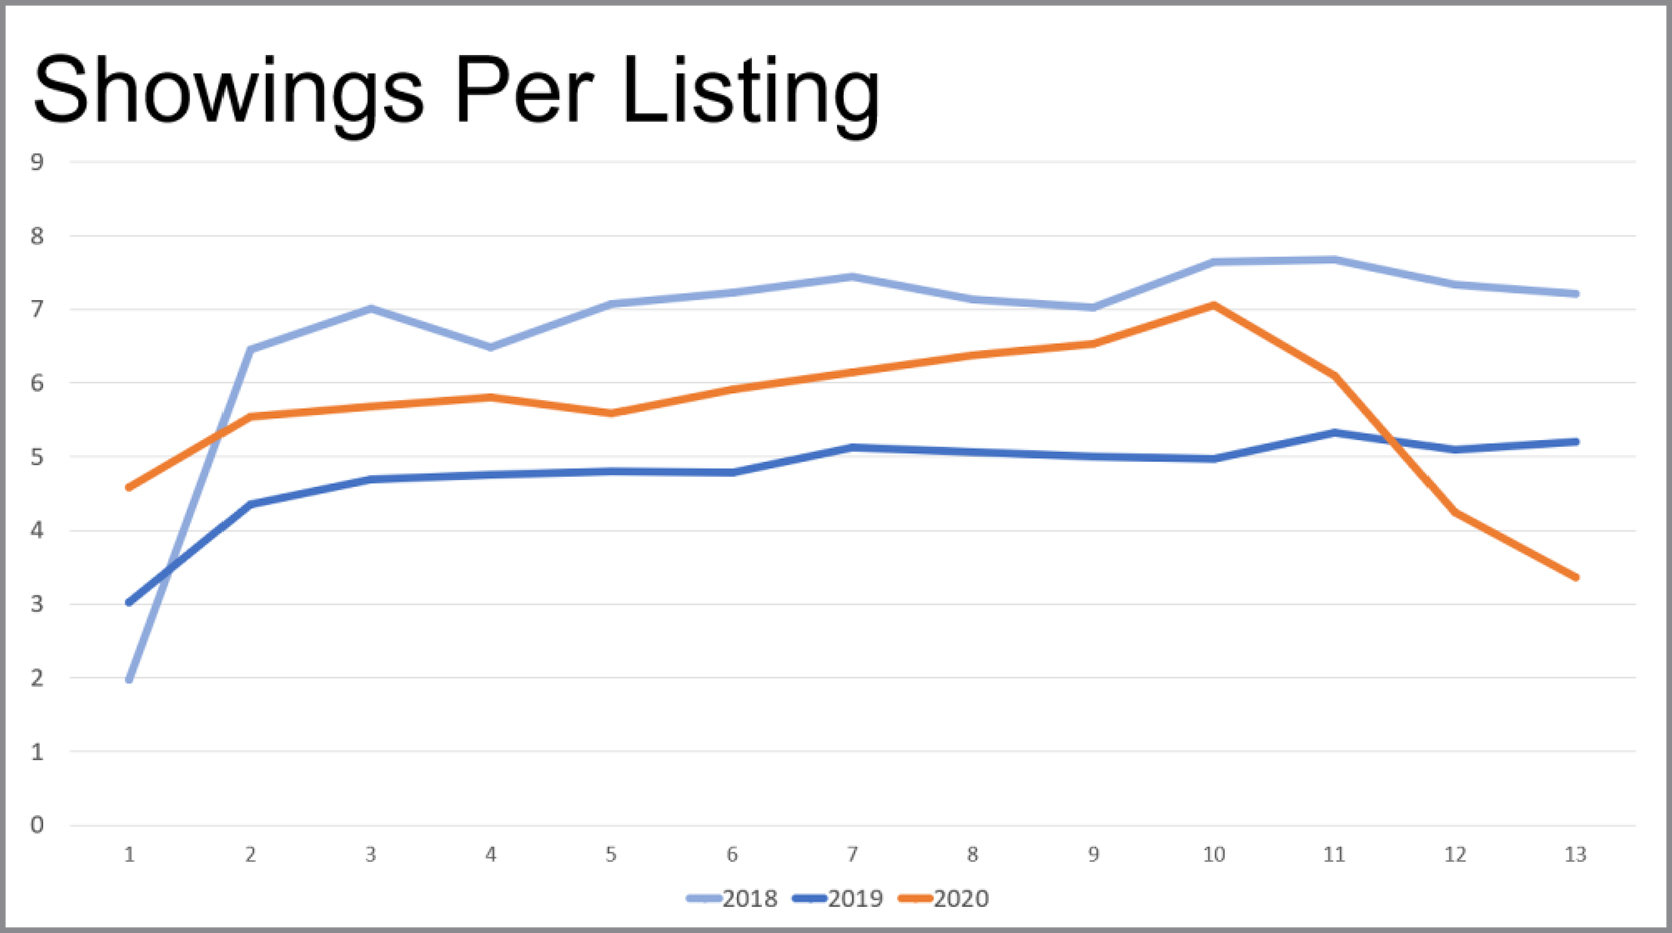
Showings per Listing:
These numbers were solidly between 2018 and 2019 levels until Week 10 and now show a marked decrease - down to around 3 showing per listing versus 5 to 7 showing per listing in the two prior years.
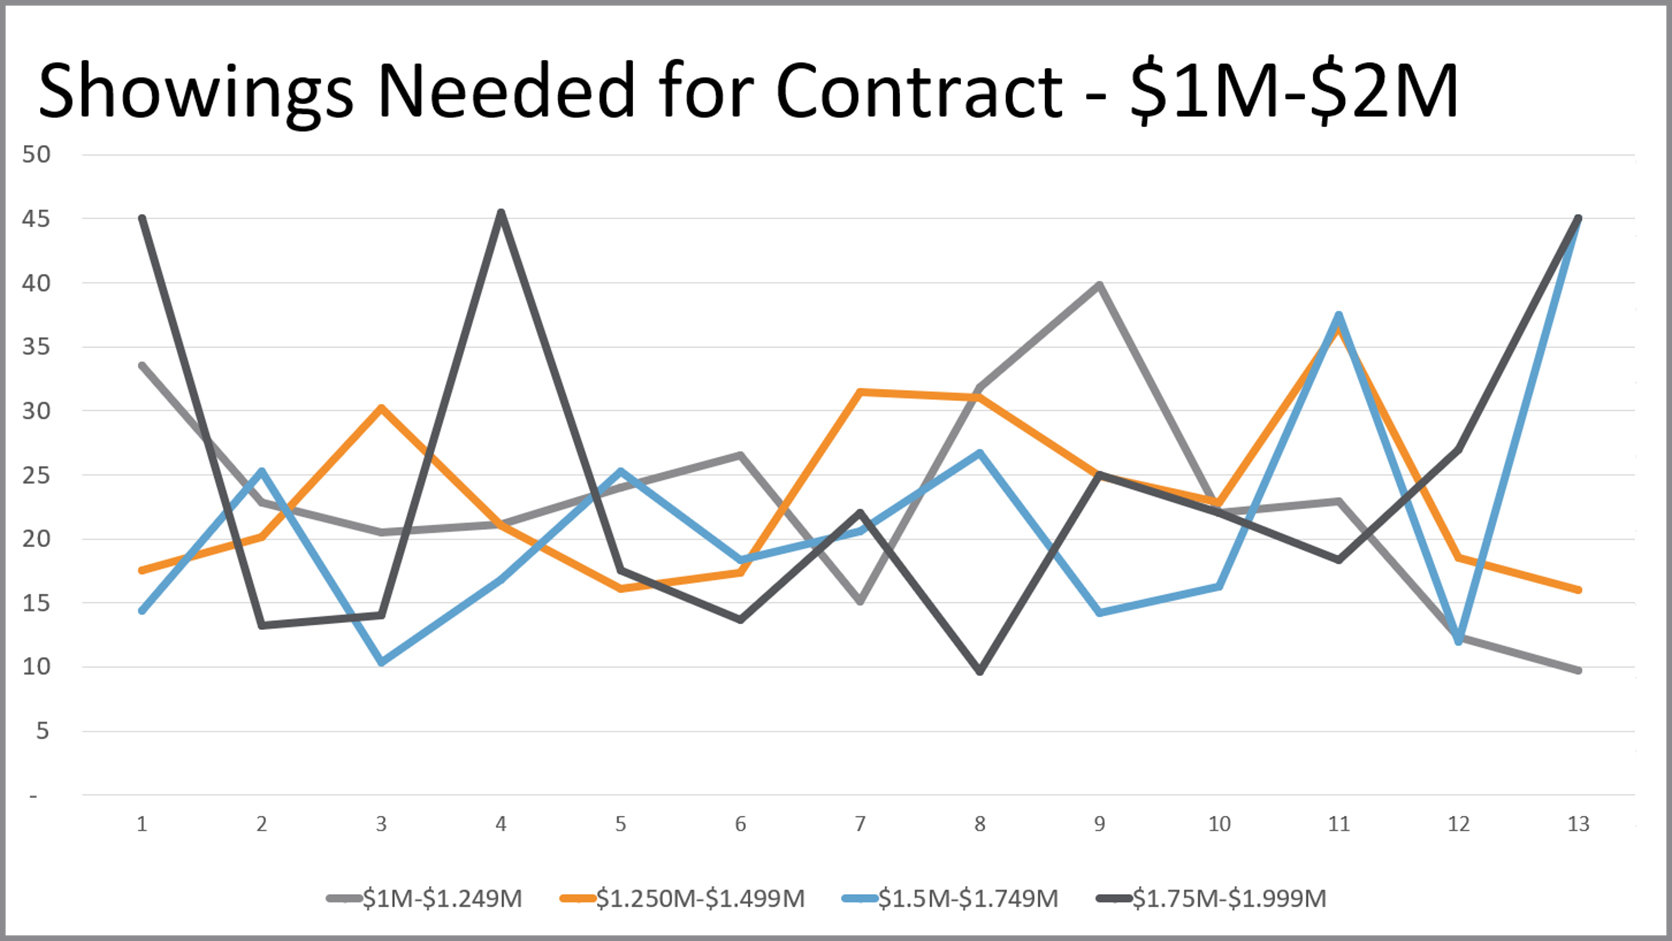
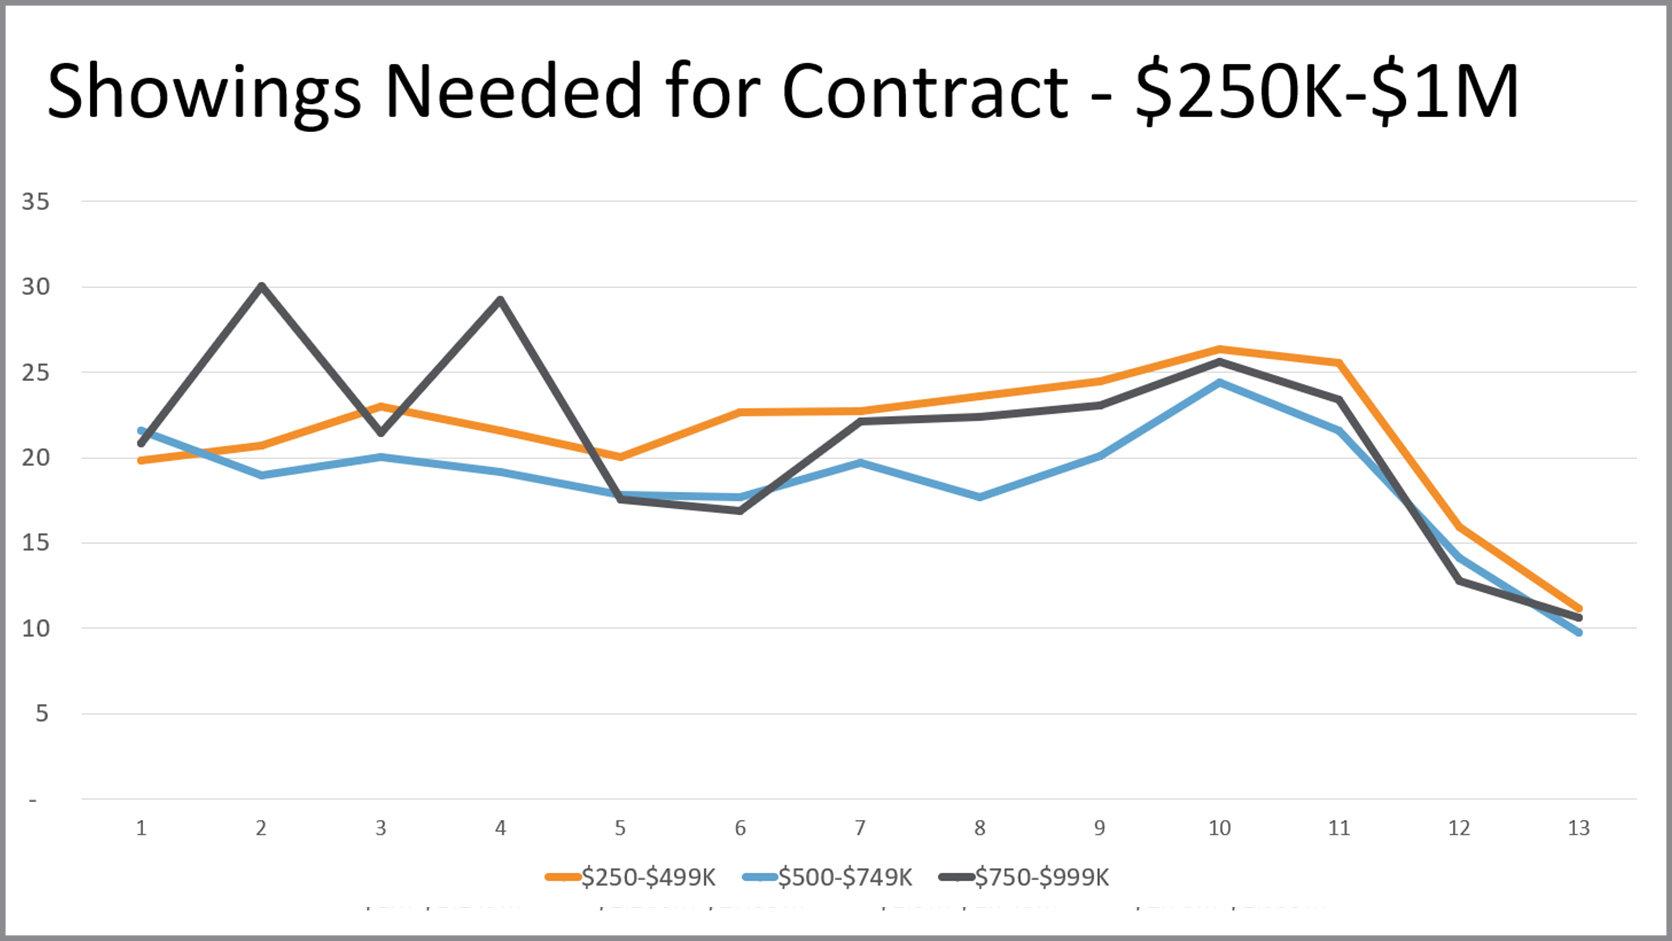
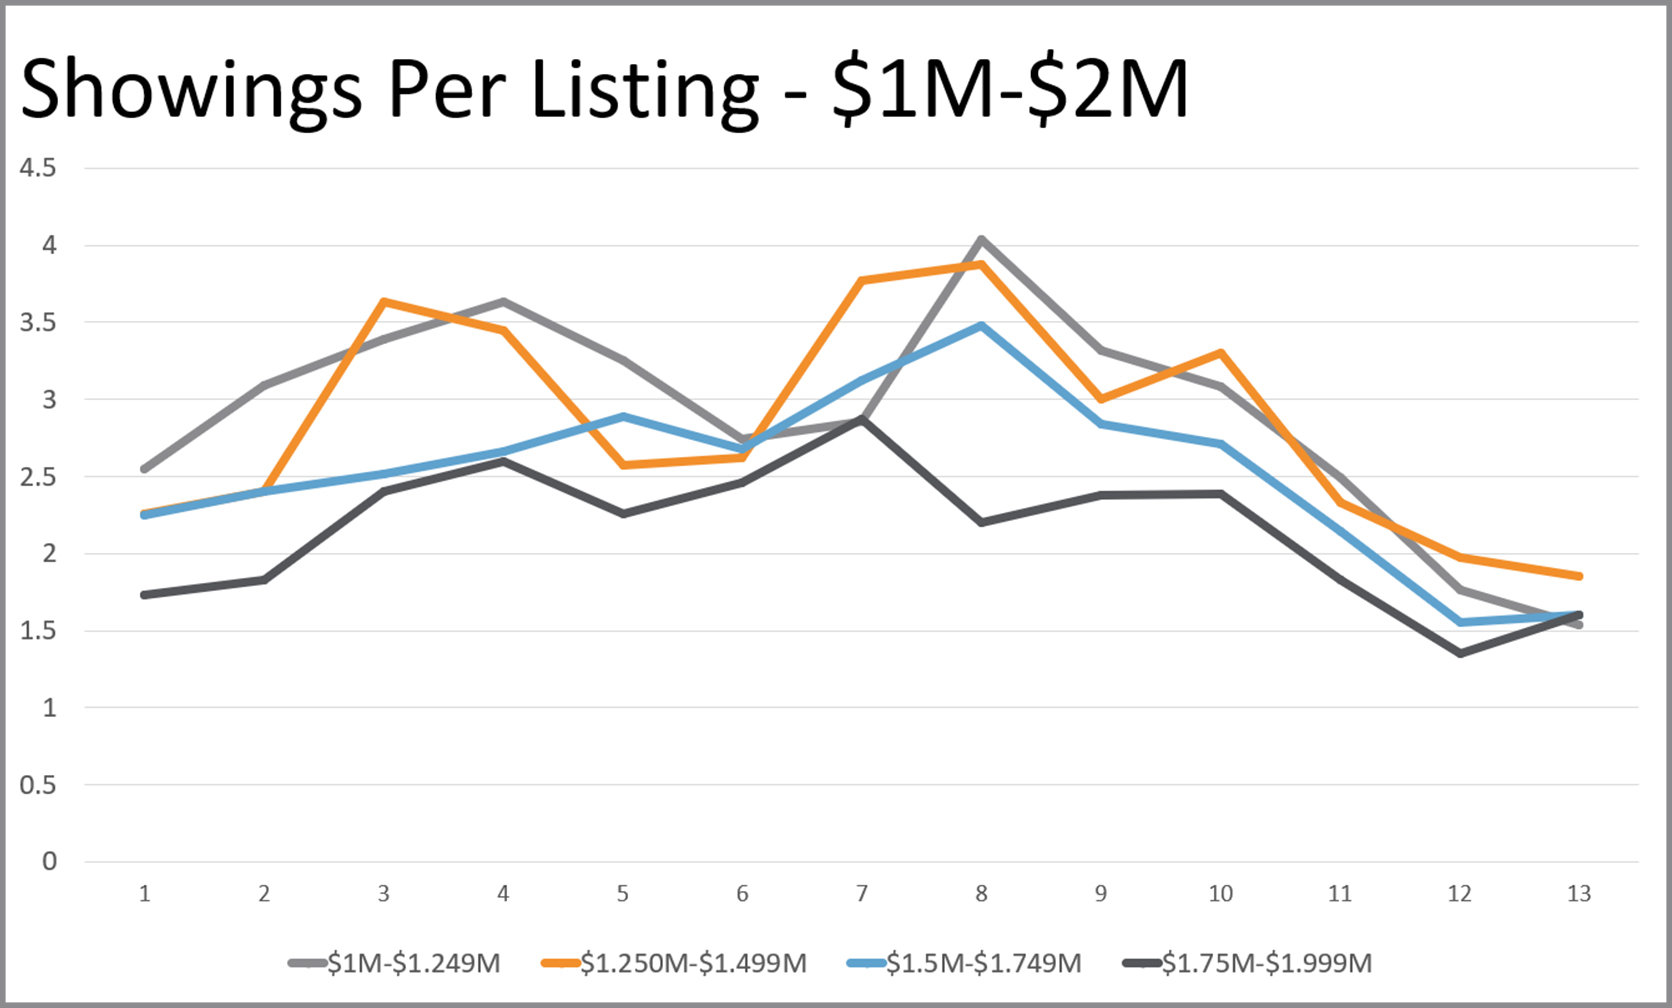
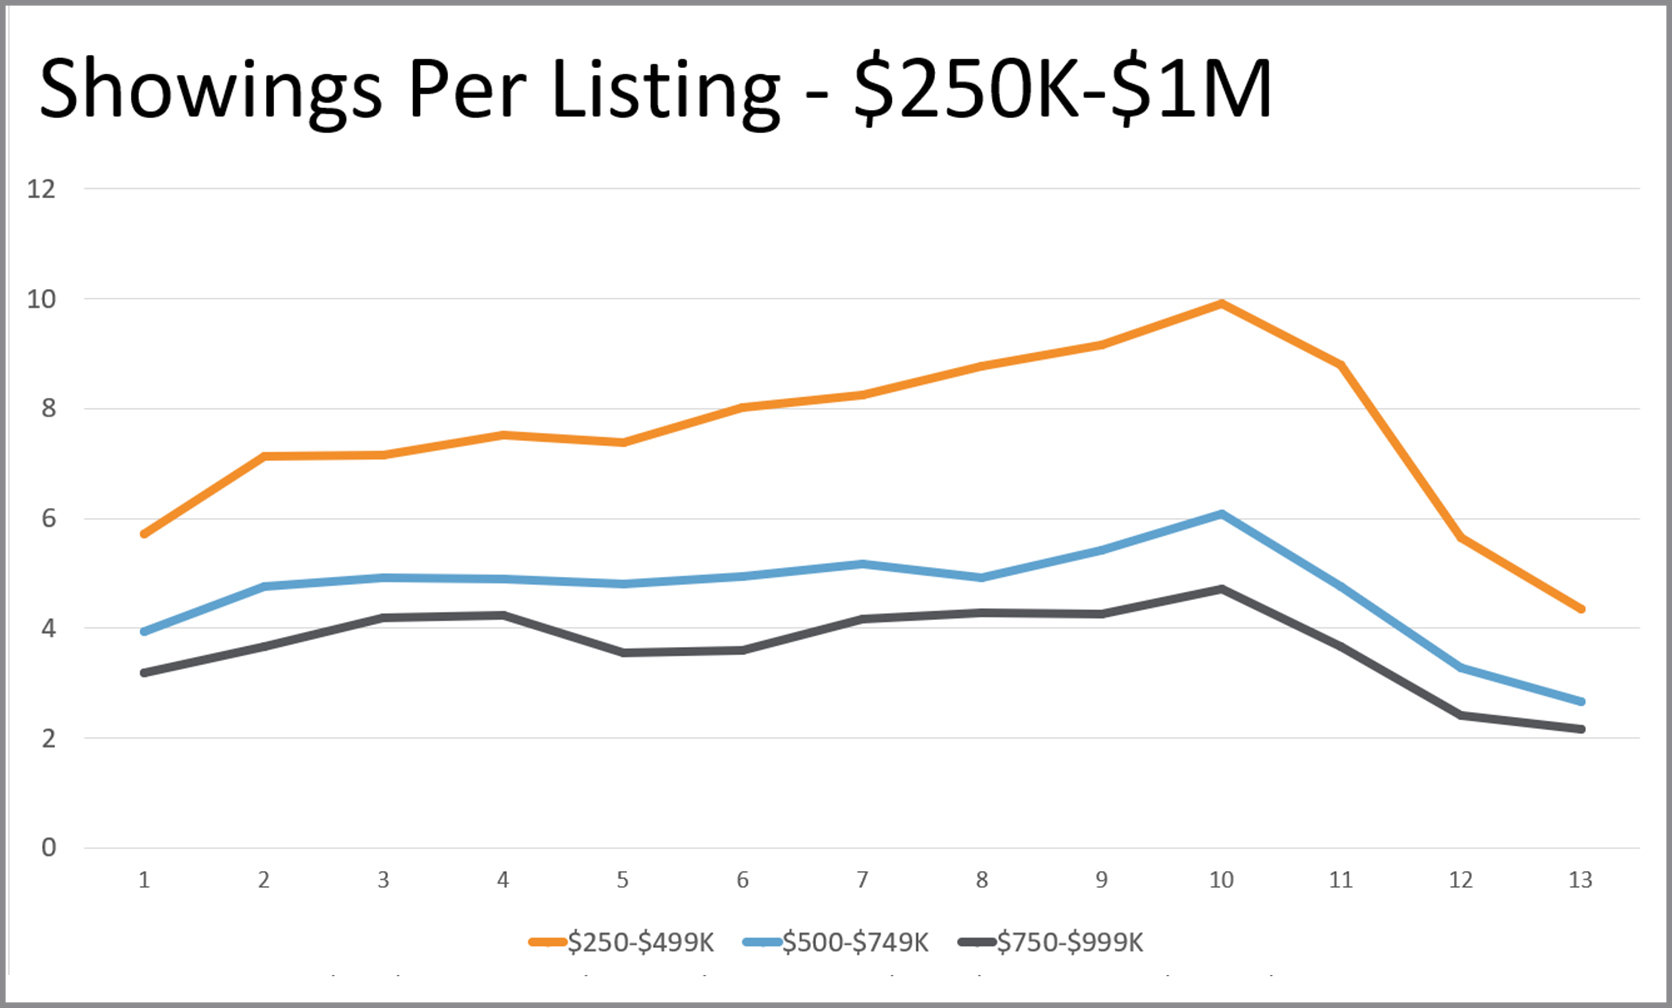
Showing per Listing by Price Range:
- $250k to $1mm: Showings per listing this year in each of the three price segments follow the same trends from Week 1 through Week 13 and consistently show that showing per listing decline as the price range increases.
- $1mm to $2mm: While there have been significantly different showing per listing this year in the four price segments shown, that variation has narrowed in recent weeks and now stands at 1.5 to 2 showings per listing regardless of price segment.