CHR WEEKLY
Findings Through Week 11&12, 2020
At CHR, we track five leading indicators of market performance and update them weekly: (1) # of new listings, (2) # of homes going under contract, (3) # of showings, (4) # withdrawn from the market and (5) # back on market. Whenever the market makes a shift, we’ll get the first indications of that here as we peer into the actual behavior of buyers and sellers in near real time.
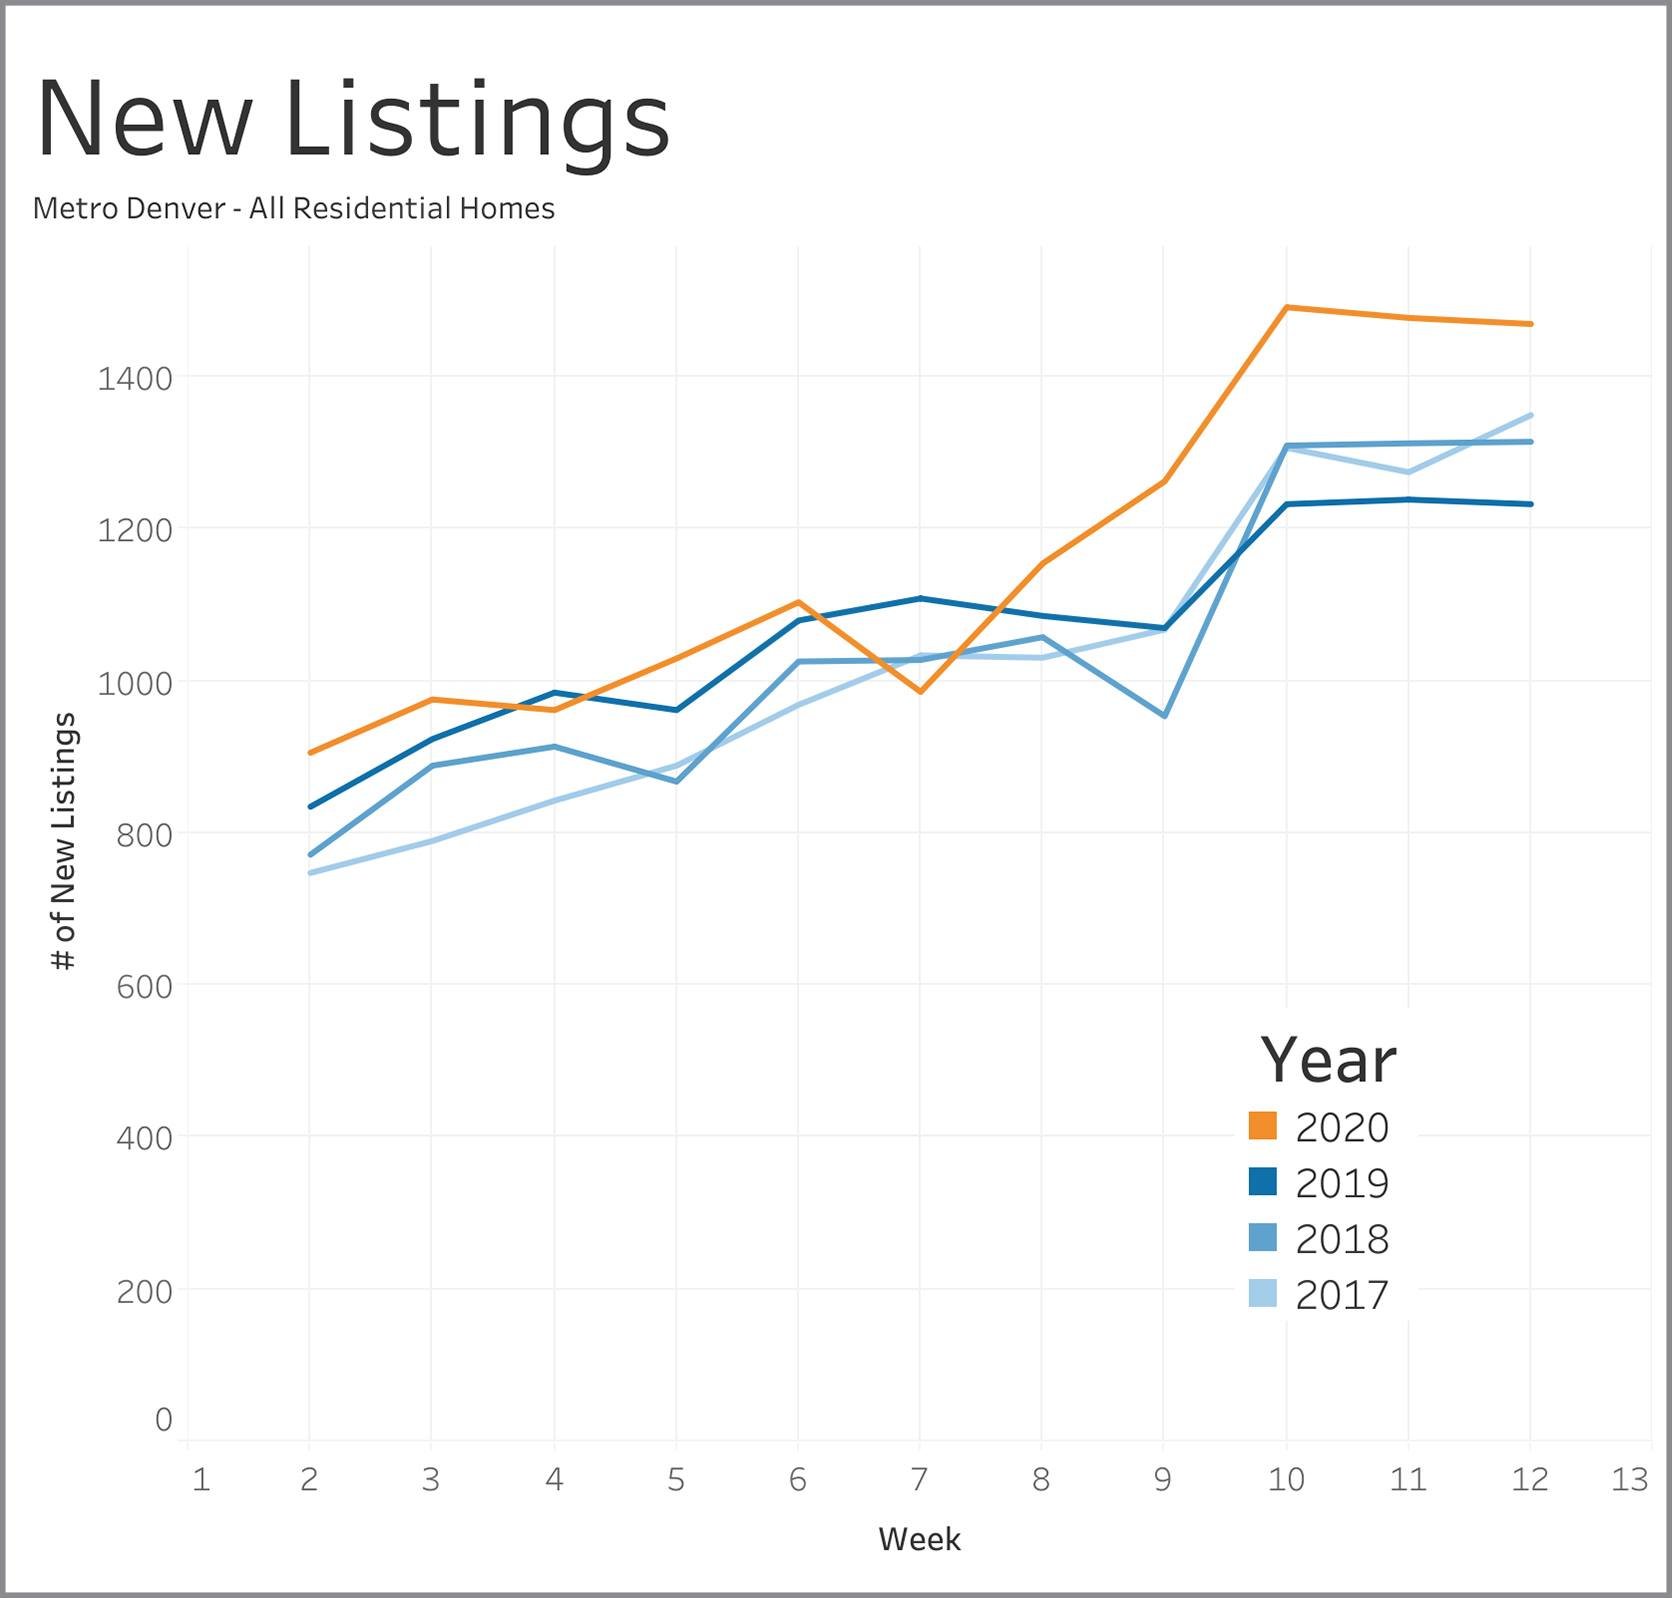
Homes New to the Market
Sellers continued to bring properties to the market at around 1500 homes per week, which is comparable to Week 10 levels and about 200 to 250 more homes weekly than in the prior three years. Owners interest in selling is remaining high.
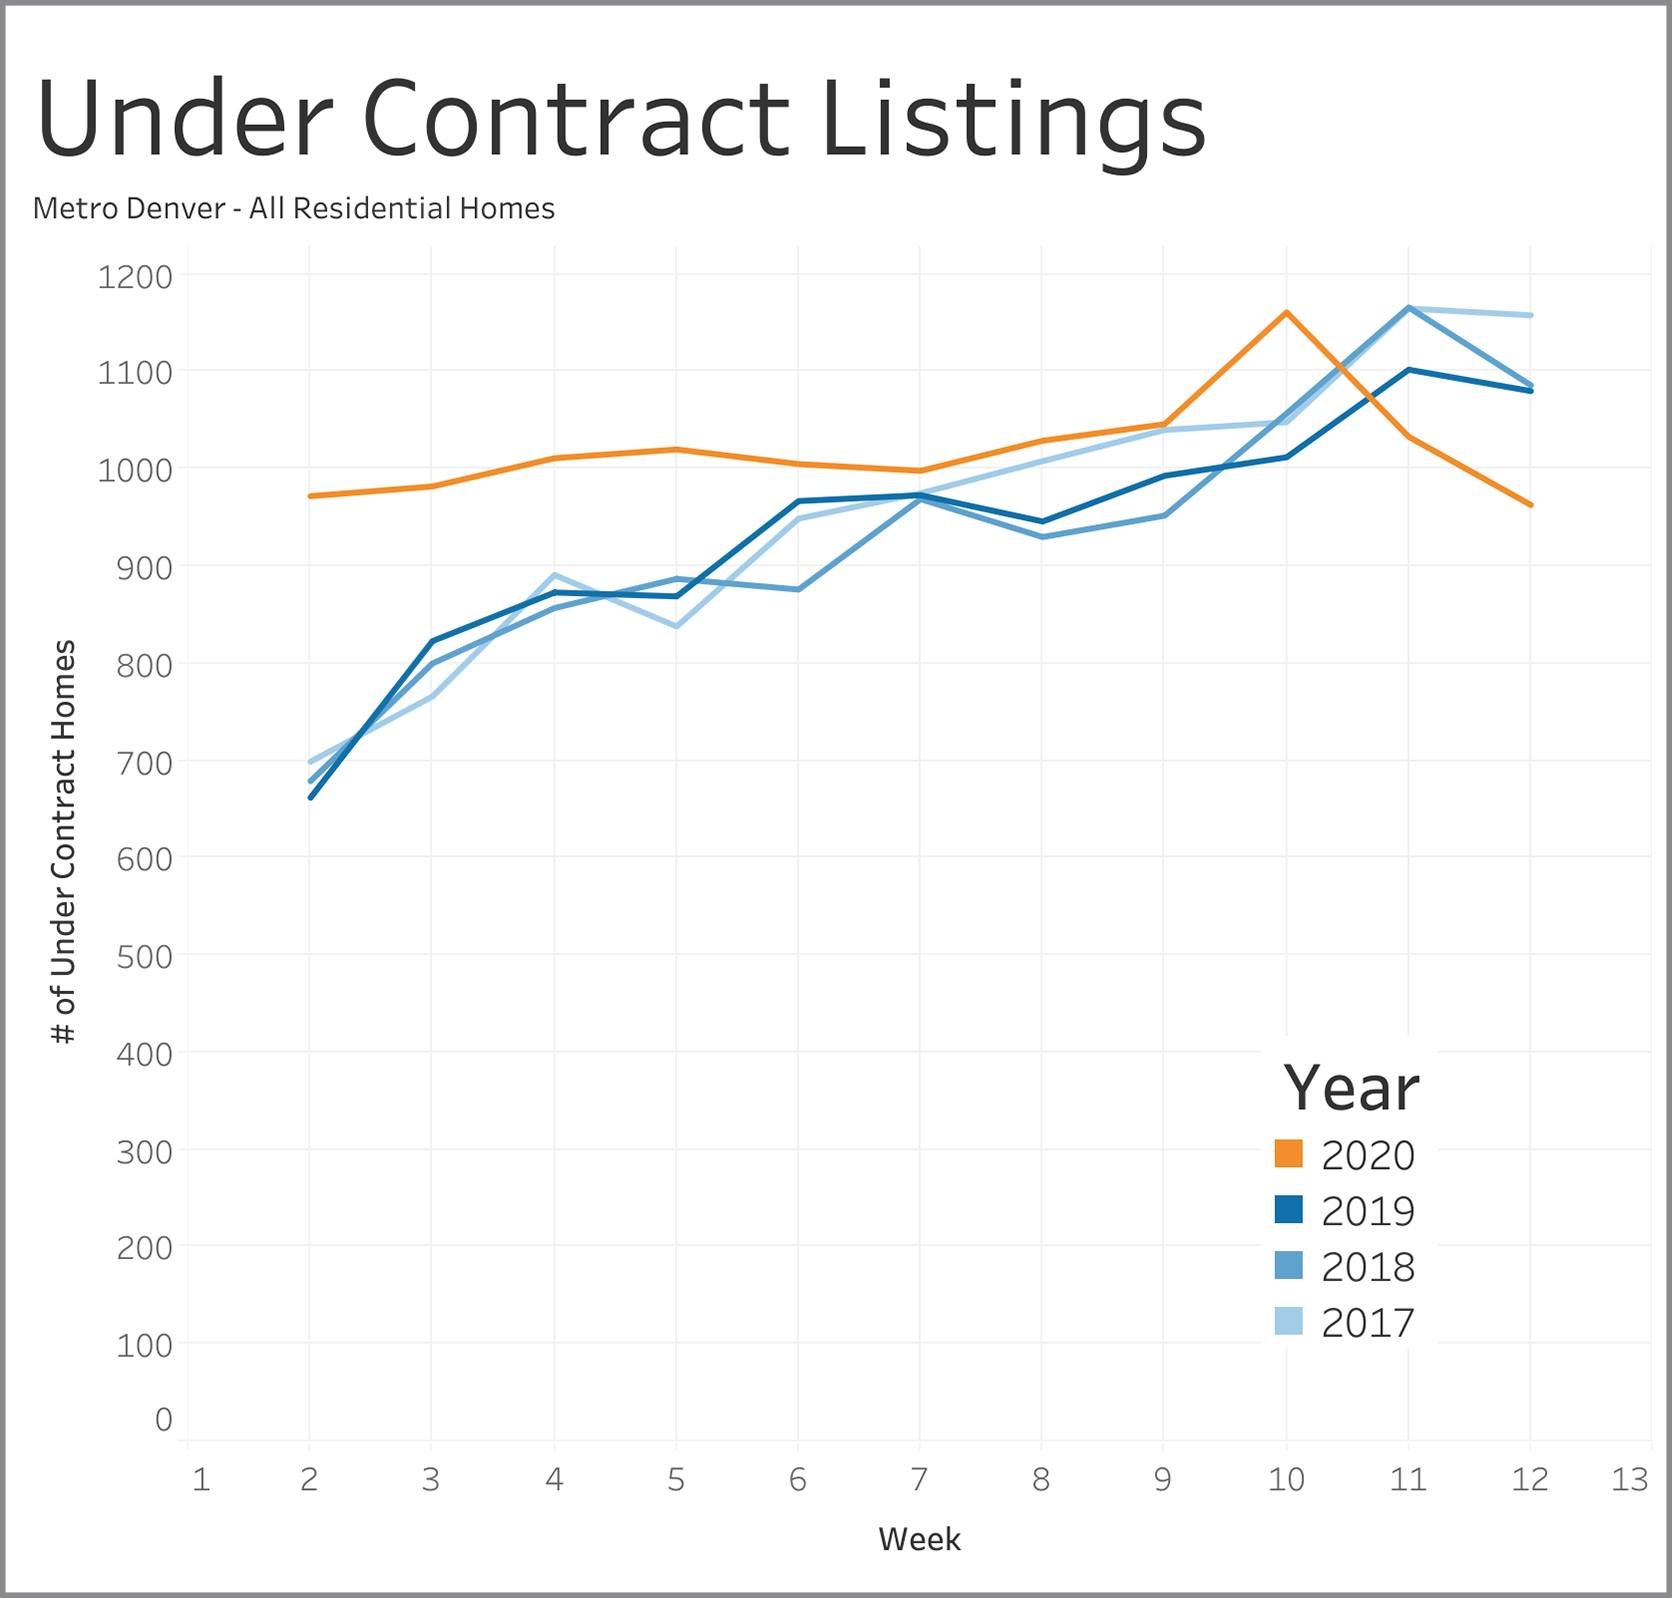
Homes Going Under Contract
A new trend was established here. The number of homes going under contract each week this year was consistently ahead of levels seen in the three prior years but fell below those levels in the last two weeks. The number fell from around 1150 in Week 10 to about 1000 homes or less per week in Week 11 and Week 12, a 13% decline. Buyers are being more cautious.
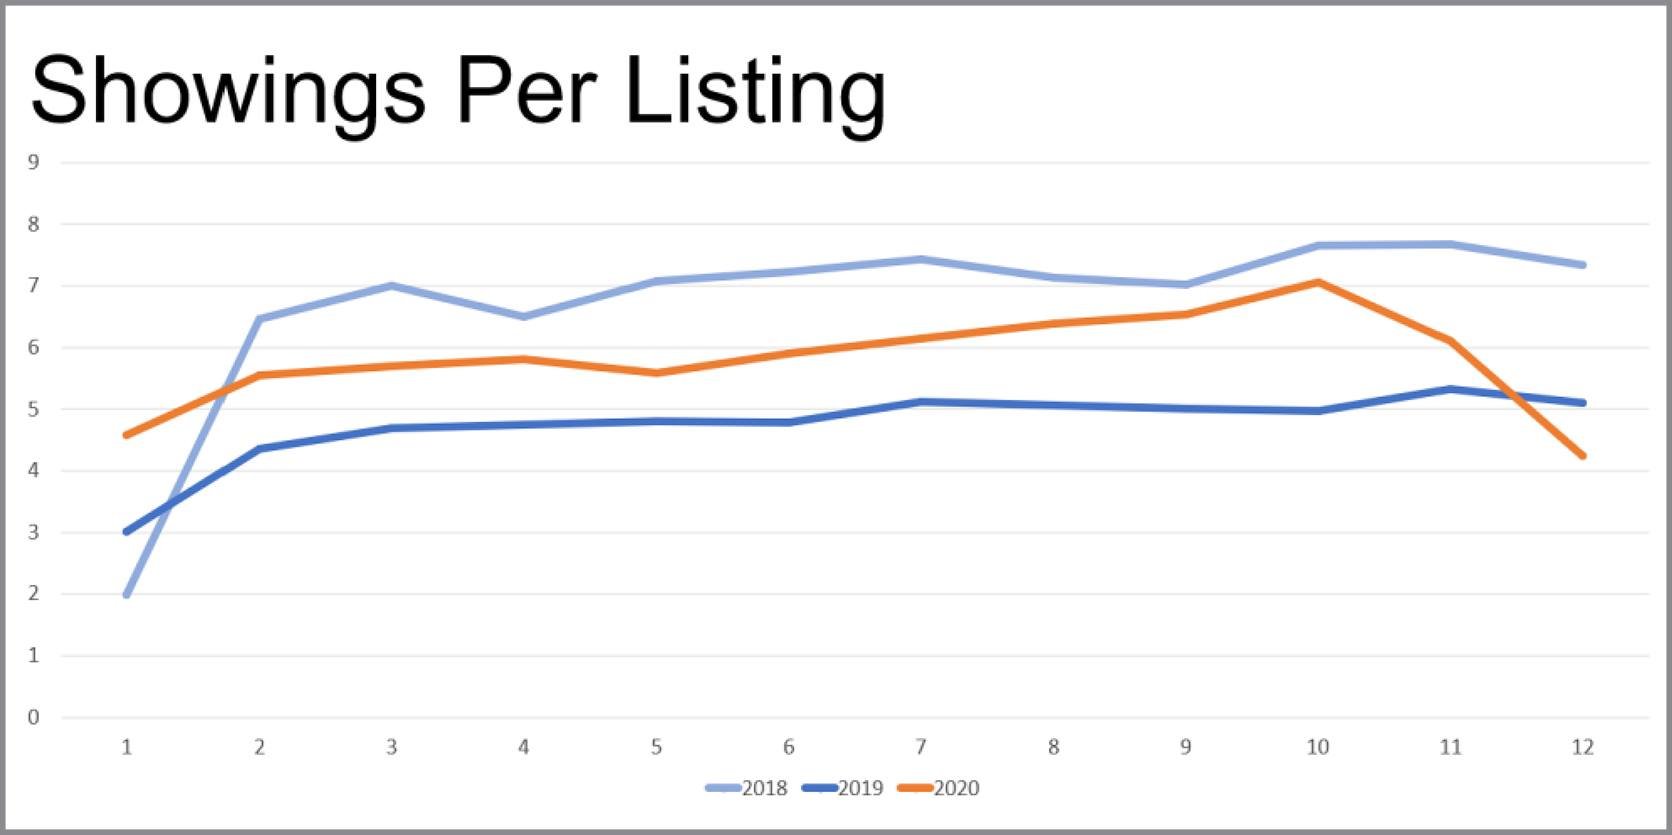
Showings Per Homes Available
Showing per listing had been running consistently above 2019 levels but fell below that mark in Week 12 at 4 showings per listing instead of 5 - a sign that there are fewer buyers in the market at the moment.
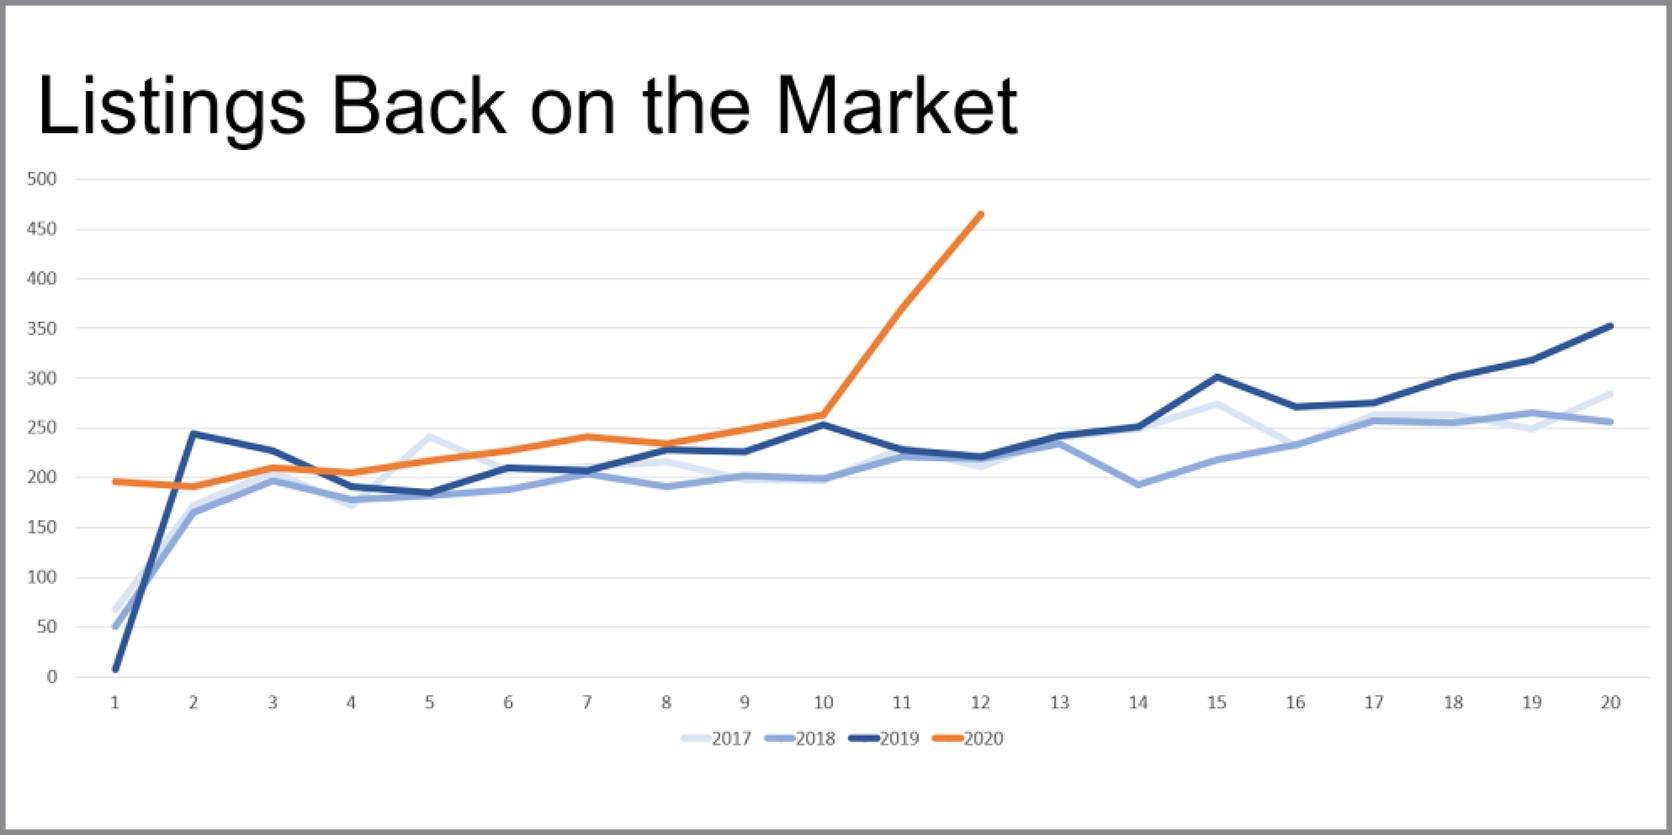
Homes Once Under Contract Coming Back on the Market
Homes coming back on the market represent sellers that had a contact but lost that buyer and are back to try a 2nd time. That number has been around 250 per week recently but jumped up markedly in Weeks 11 and 12. This is consistent with patterns in other charts on this page indicating buyers are a bit nervous but seller interest in continuing the process is high.
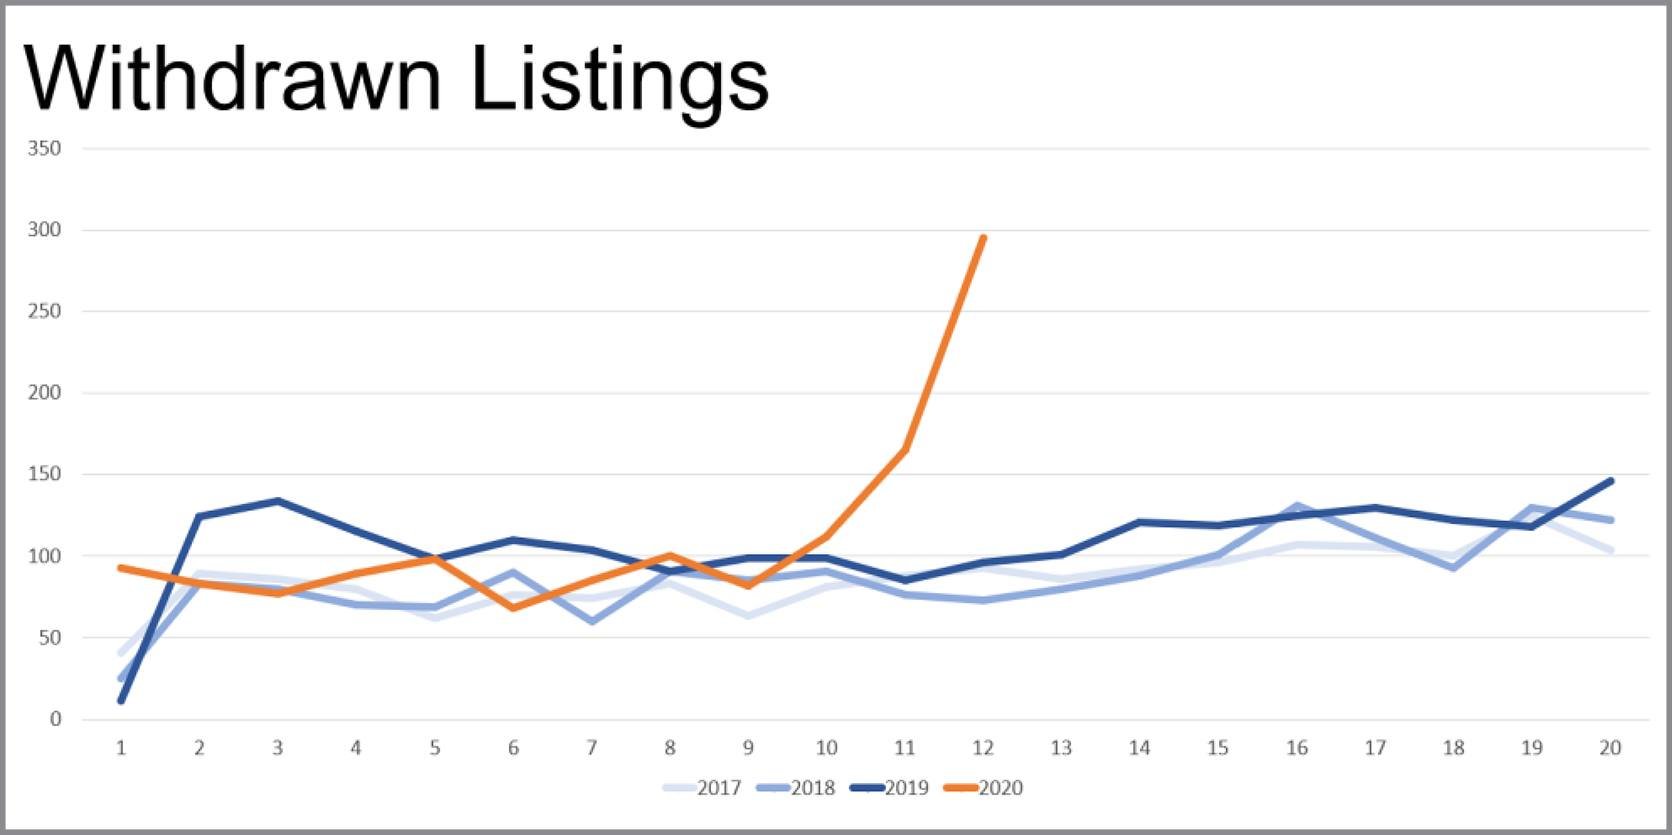
Homes With Showings Temporarily Suspended
Sellers can take a break from showing their home using a “temporarily withdrawn from showing” status. The number of sellers that did so in Week 12 was almost 300, which is well above the 80 to 100 that did so in prior years.
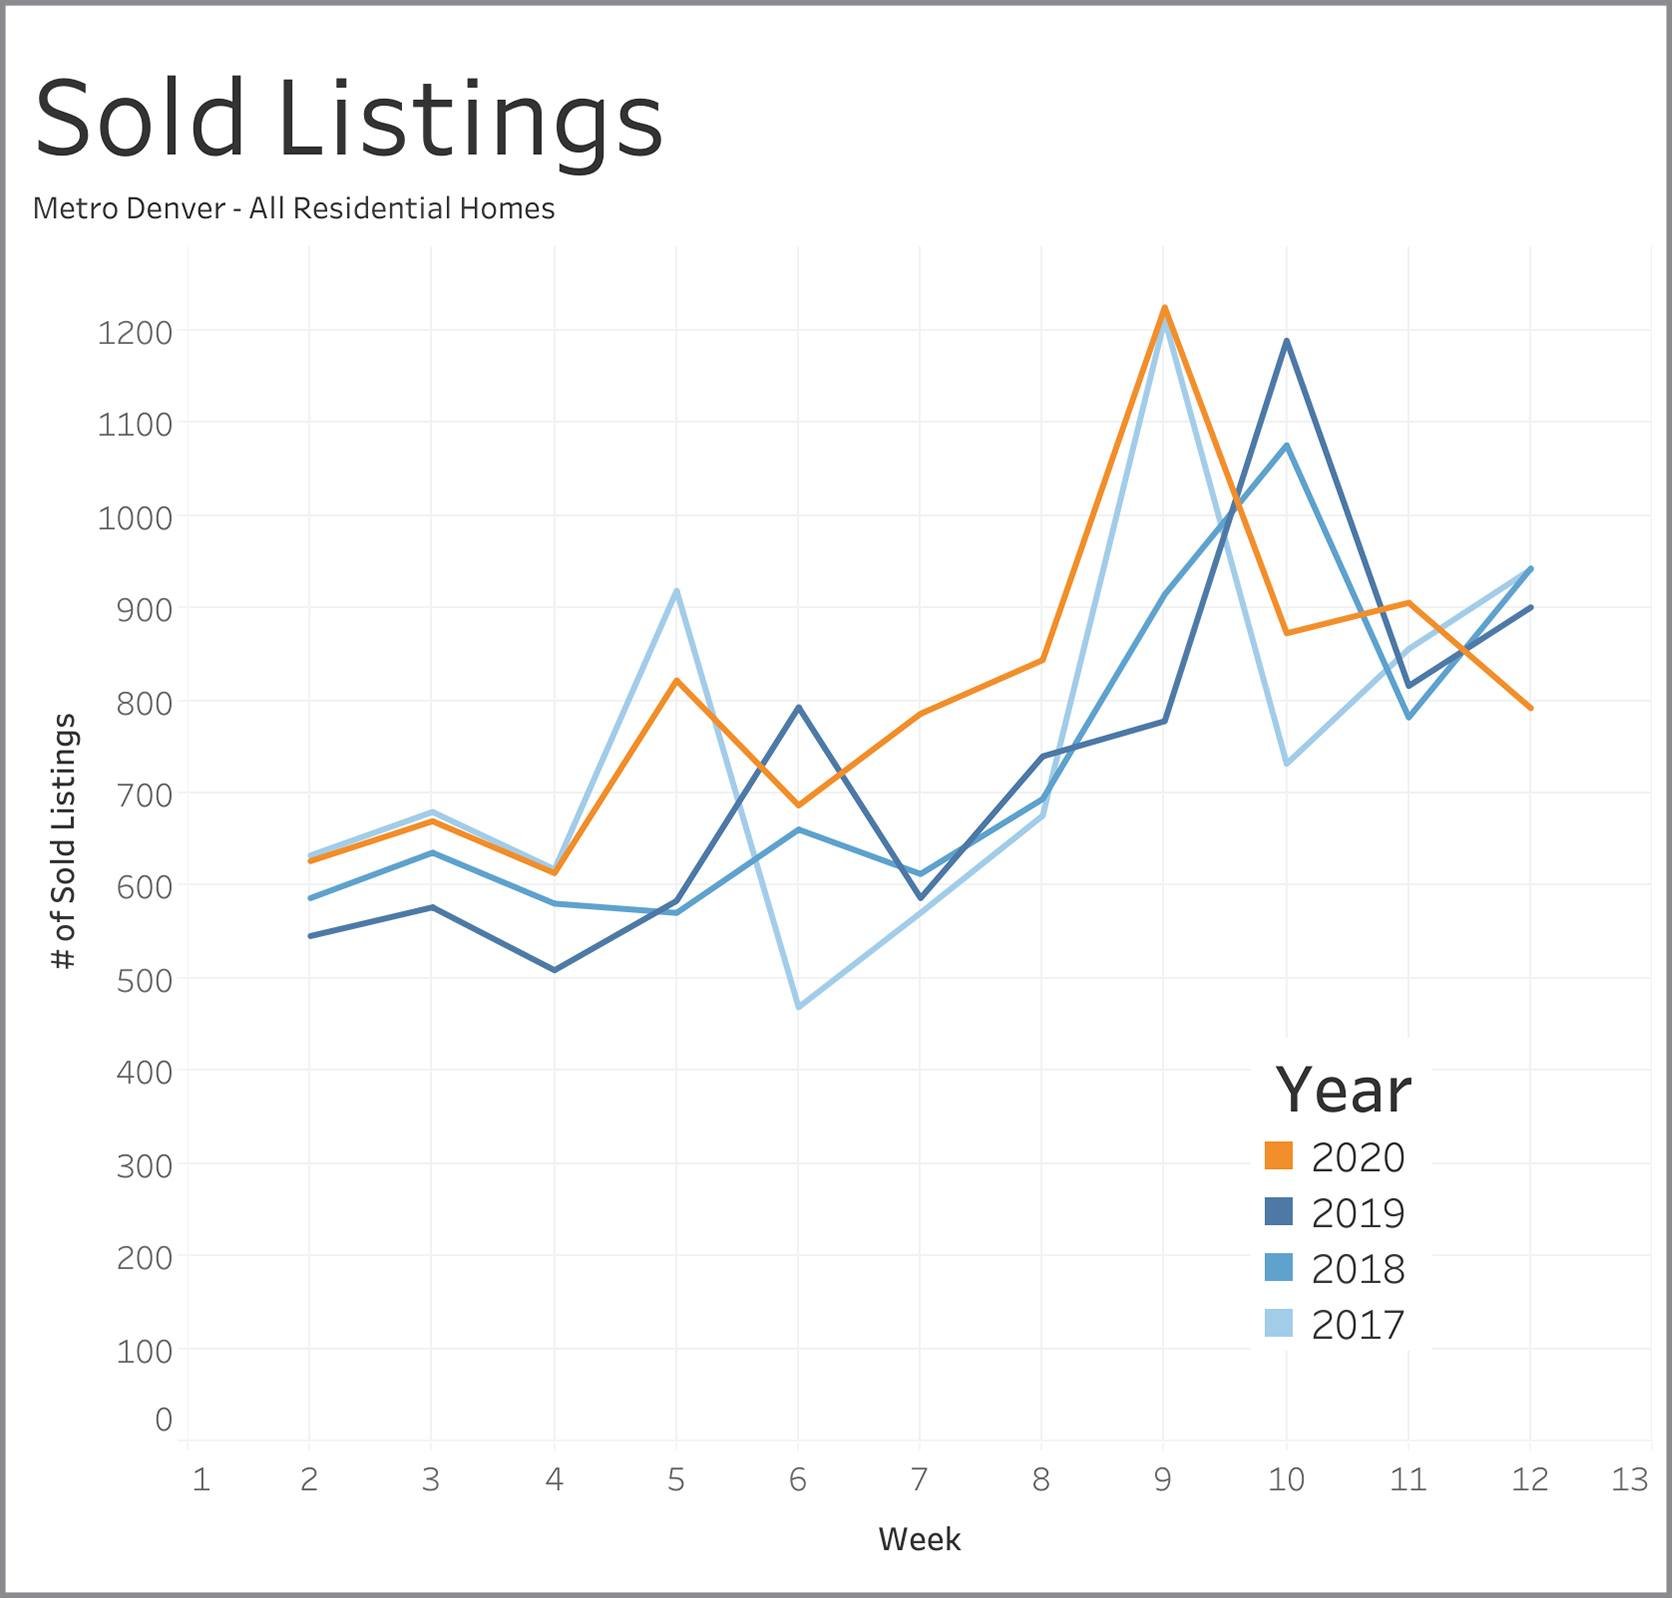
Homes Closed
Number of homes closed in Week 12 were just under 800 versus a bit over 900 in prior years. The weekly number of closings can vary quite a bit. We’ll be watching this one in future weeks to see if a new pattern is emerging.
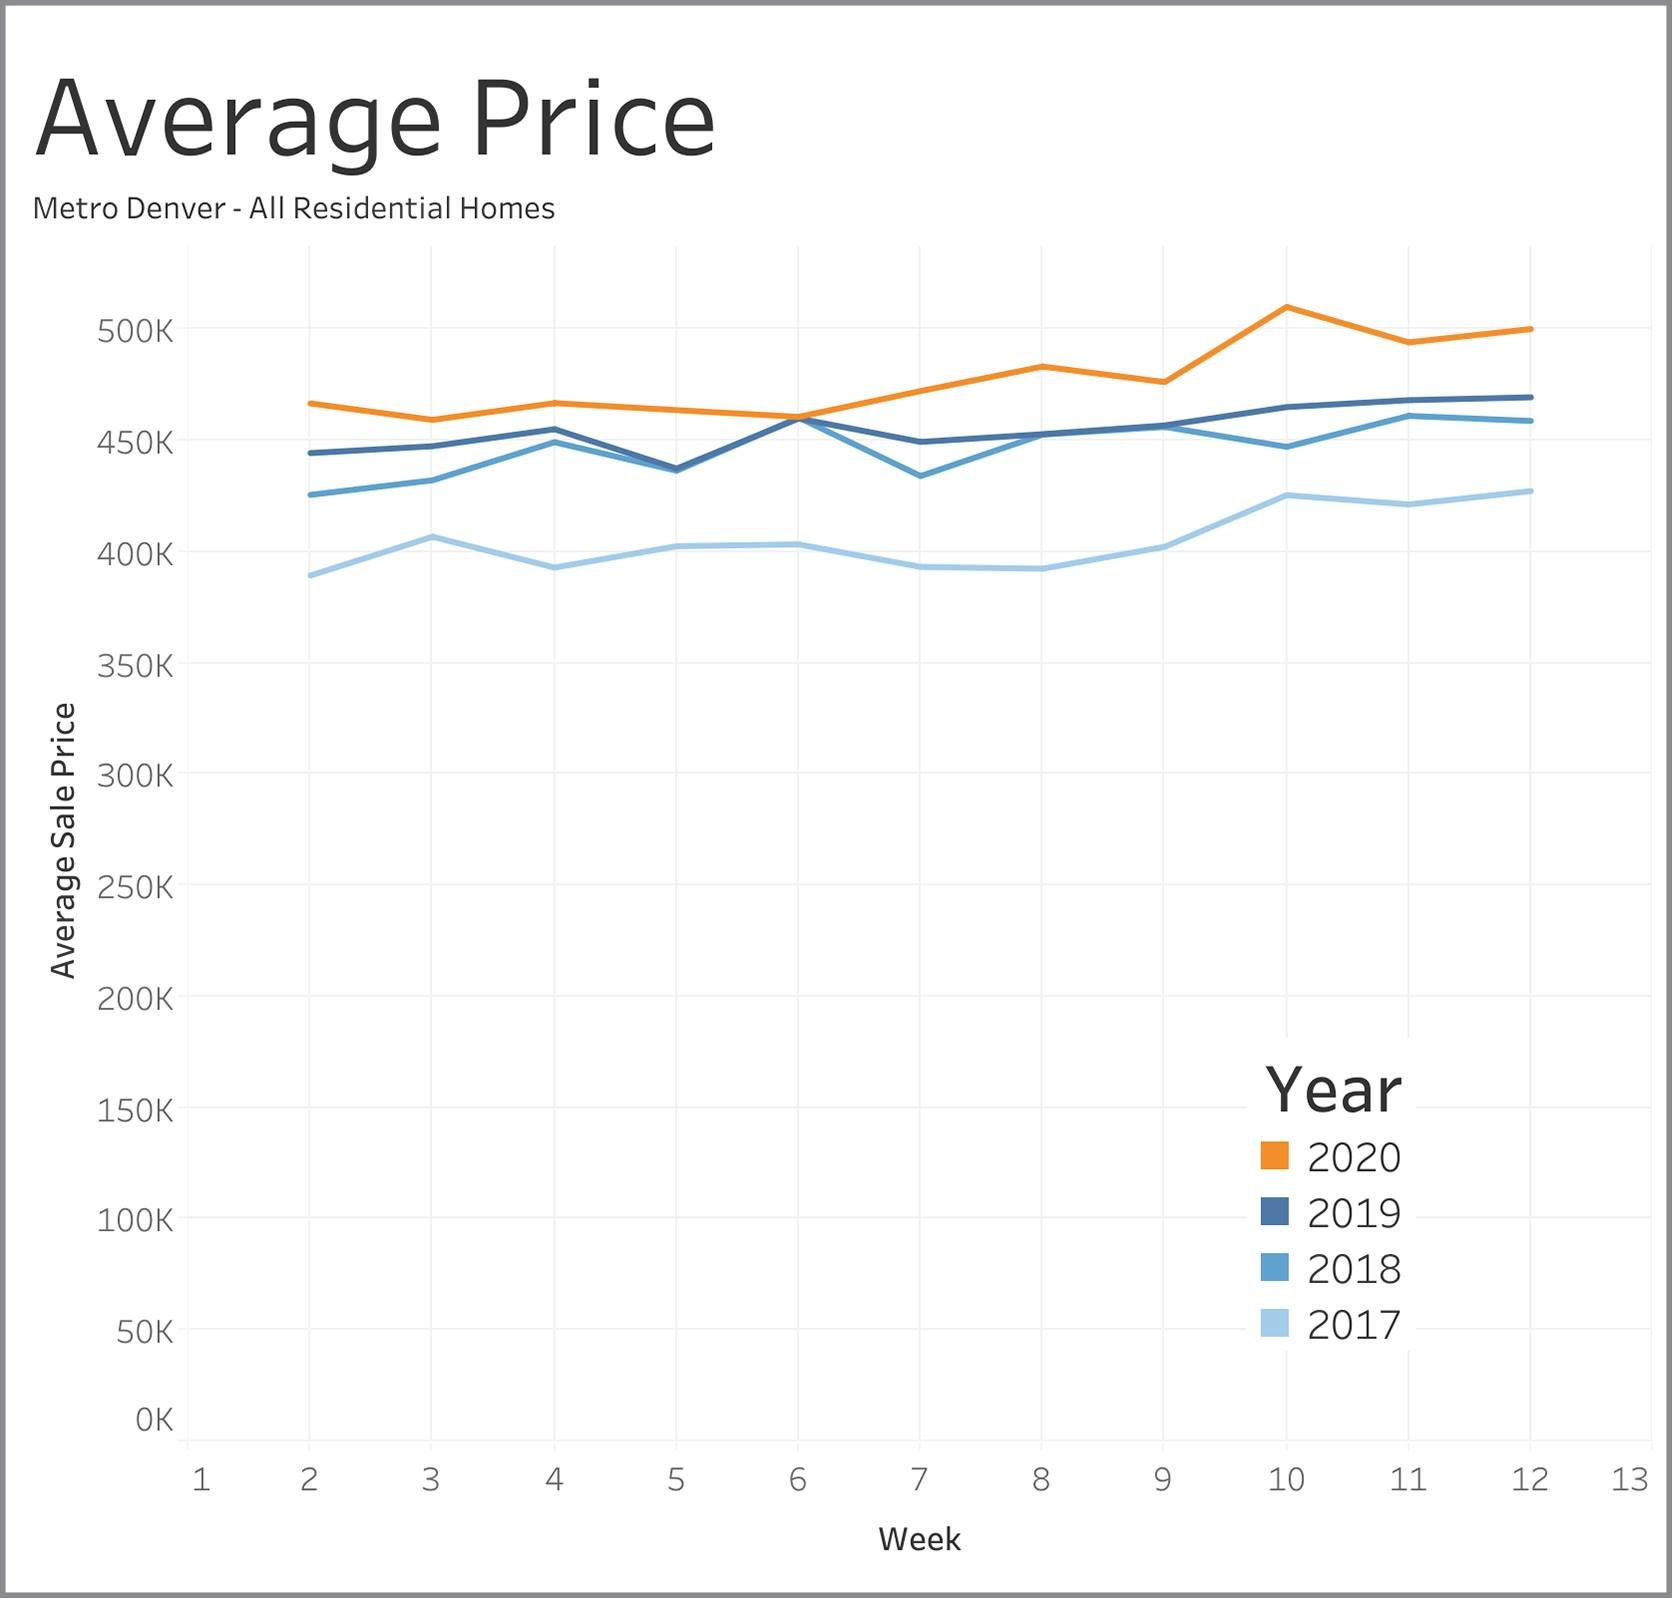
Average Price of Closed Homes
The average sale price of all homes closed in Week 12 continued the trend of prior weeks by being well above the average price of prior years – up over 6% from a year ago.
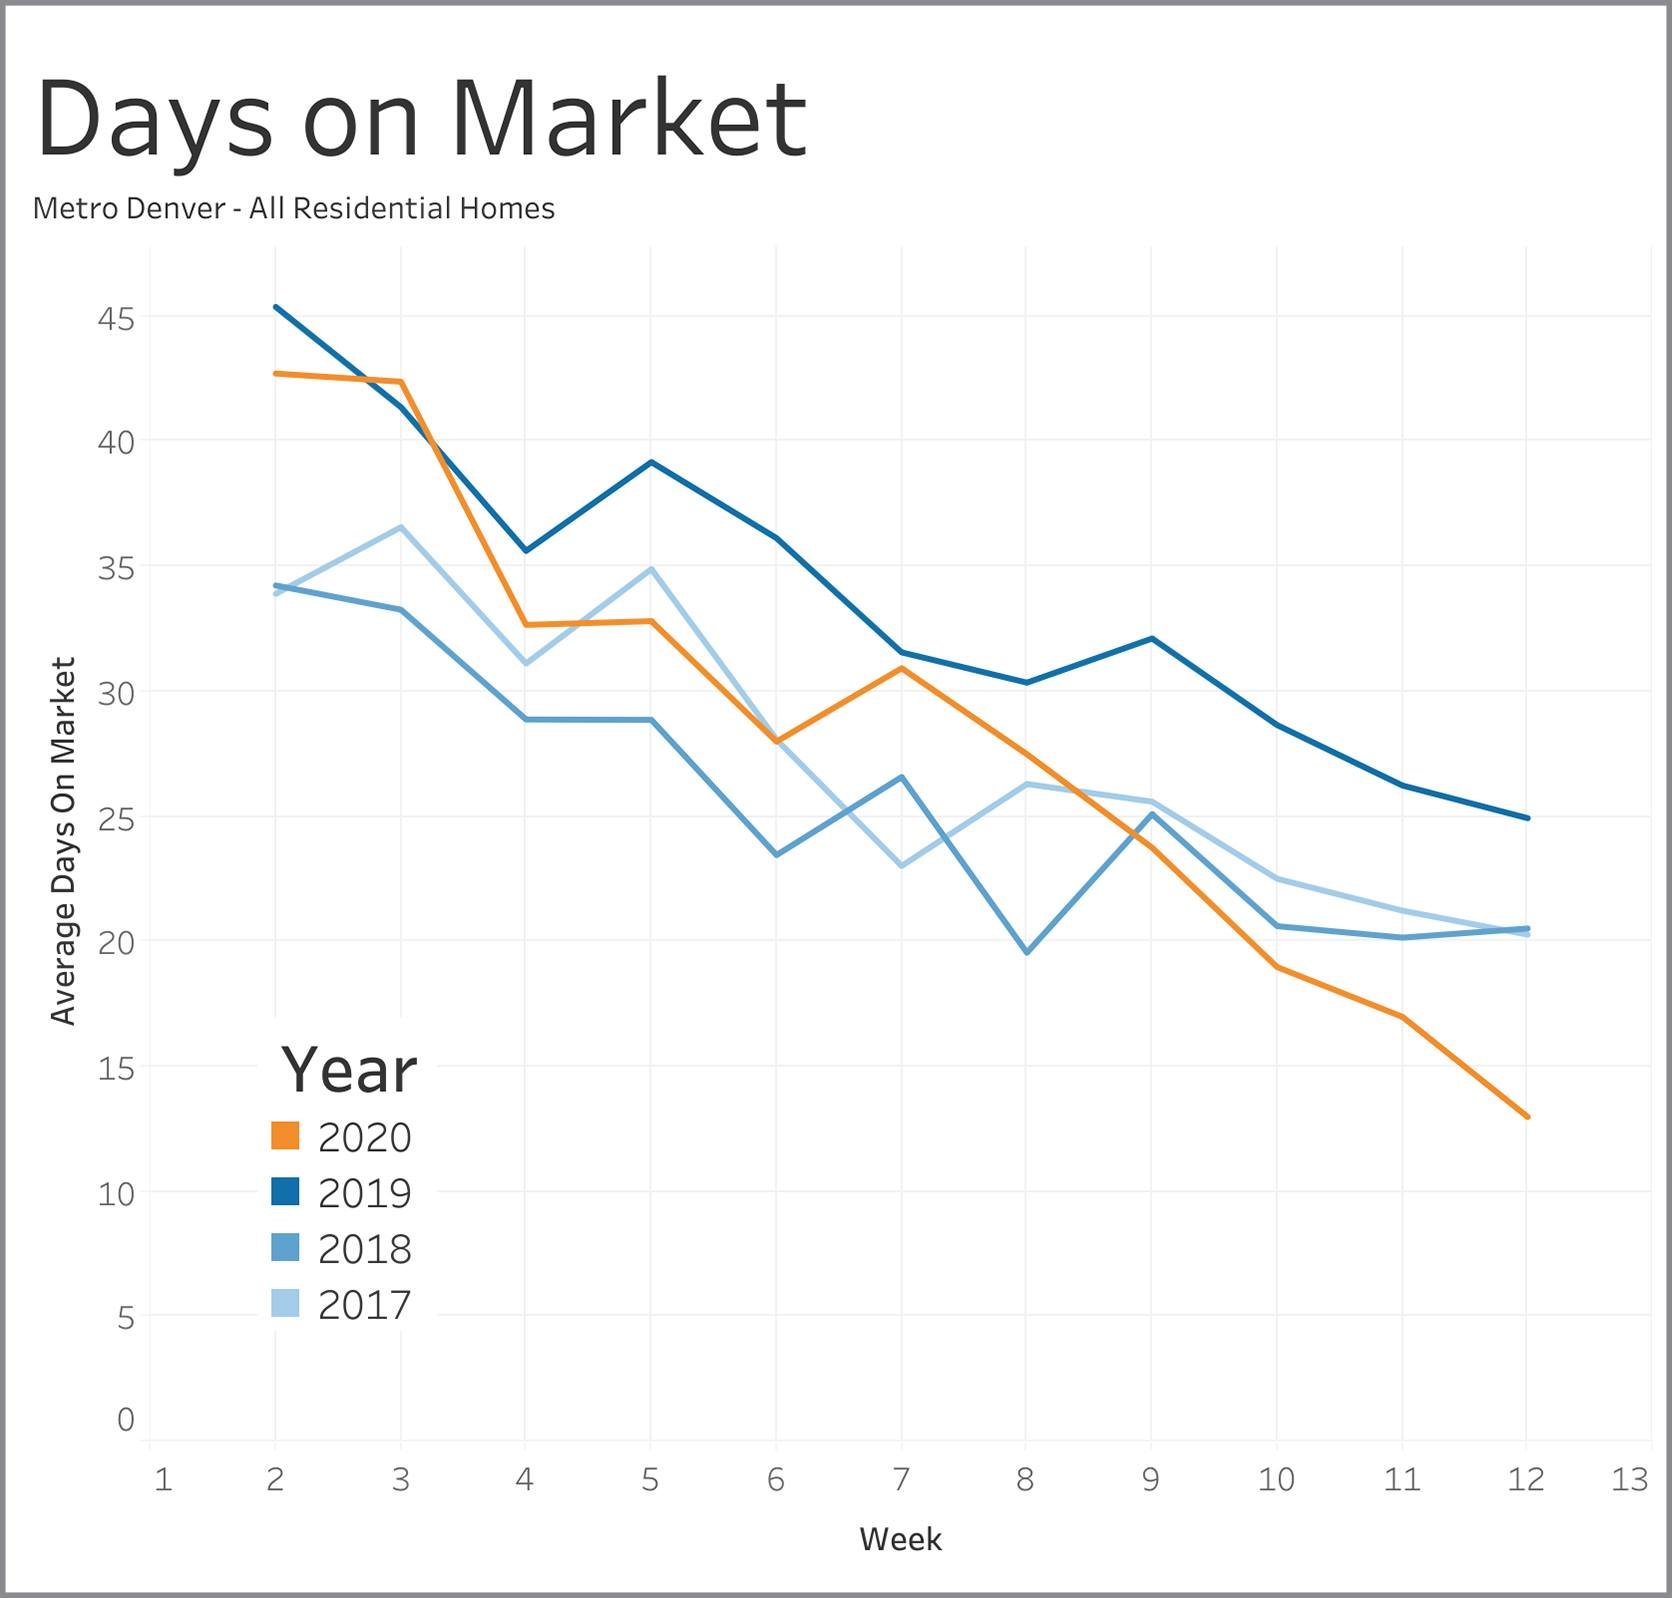
Days Required to Get Under Contract
Homes are selling more quickly. The typical seller that went under contract in Week 12 took just 13 days on average to find a buyer versus the 20 to 24 days it was taking in the three prior years. Buyers are making decisions quickly.
